
Data Analysis: Is Global Liquidity Drying Up?

Author: Michael Nadeau
Translation: Baihua Blockchain
The post-pandemic era has been defined by fiscal dominance—a government deficit and short-term Treasury bill-driven economy, where liquidity remains high even as the Federal Reserve maintains high interest rates.
Today, we are entering a phase dominated by the private sector. Compared to the previous administration, the Treasury is now reclaiming liquidity through tariffs and spending restrictions.
This is why interest rates need to come down.
We analyze the current cycle from the perspective of global liquidity to highlight why the current round of “devaluation trades” is reaching its final stage.
Is Fiscal Dominance Coming to an End?
We always want to “buy the dip” when everyone else is “chasing the rally.”
This is why all the recent discussions about the “devaluation trade” have caught our attention.
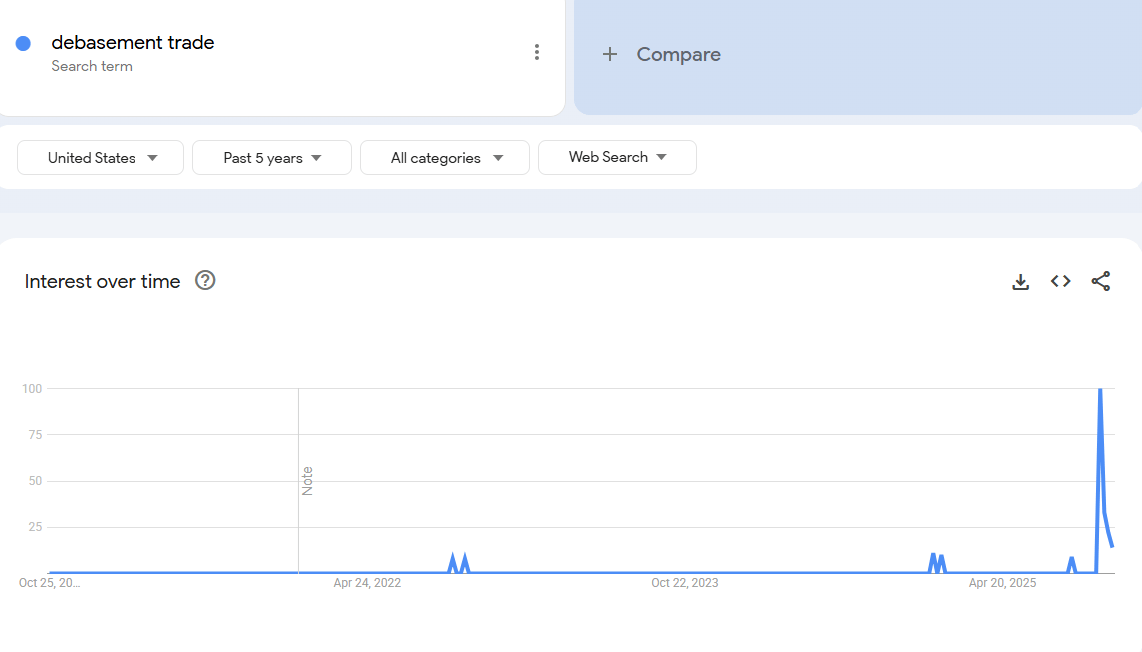
In our view, the right time to be interested in the “devaluation trade” was a few years ago. At that time, bitcoin was priced at $25,000 and gold at $2,000. Back then, no one was talking about it except for crypto and macro analysts.
From our perspective, this “trade” is basically done.
Therefore, our job is to understand the conditions that created it, and whether those conditions will persist.
What drove this trade? In our view, there were two main factors.
1. Treasury spending. During the Biden administration, we implemented massive fiscal deficits.
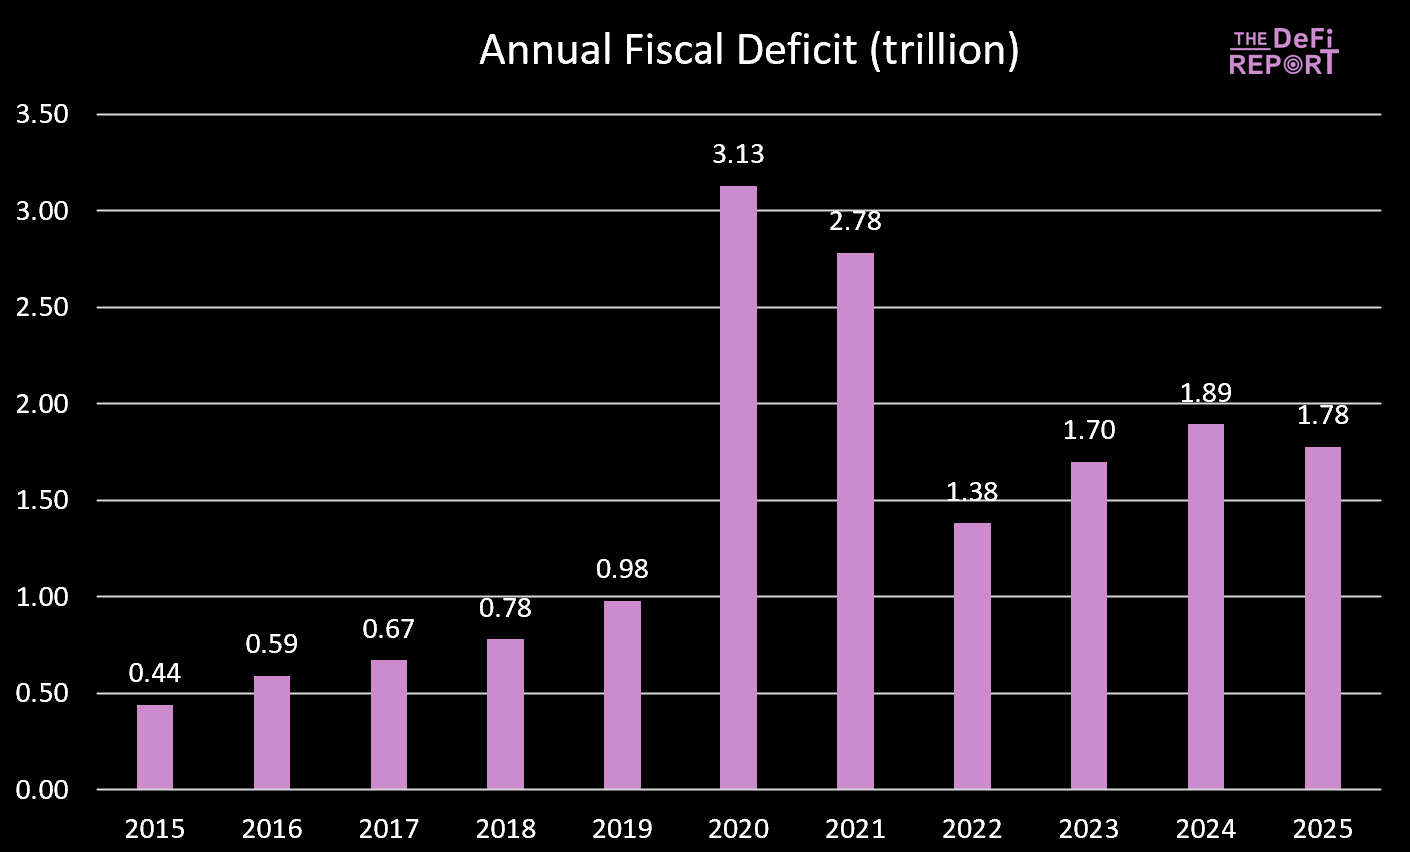
The 2025 fiscal year has just ended, and the deficit has slightly decreased—mainly due to increased tax revenue (tariffs) rather than reduced spending. However, the “Big Beautiful Bill” is expected to achieve spending cuts by reducing benefits for Medicaid and the Supplemental Nutrition Assistance Program (SNAP).
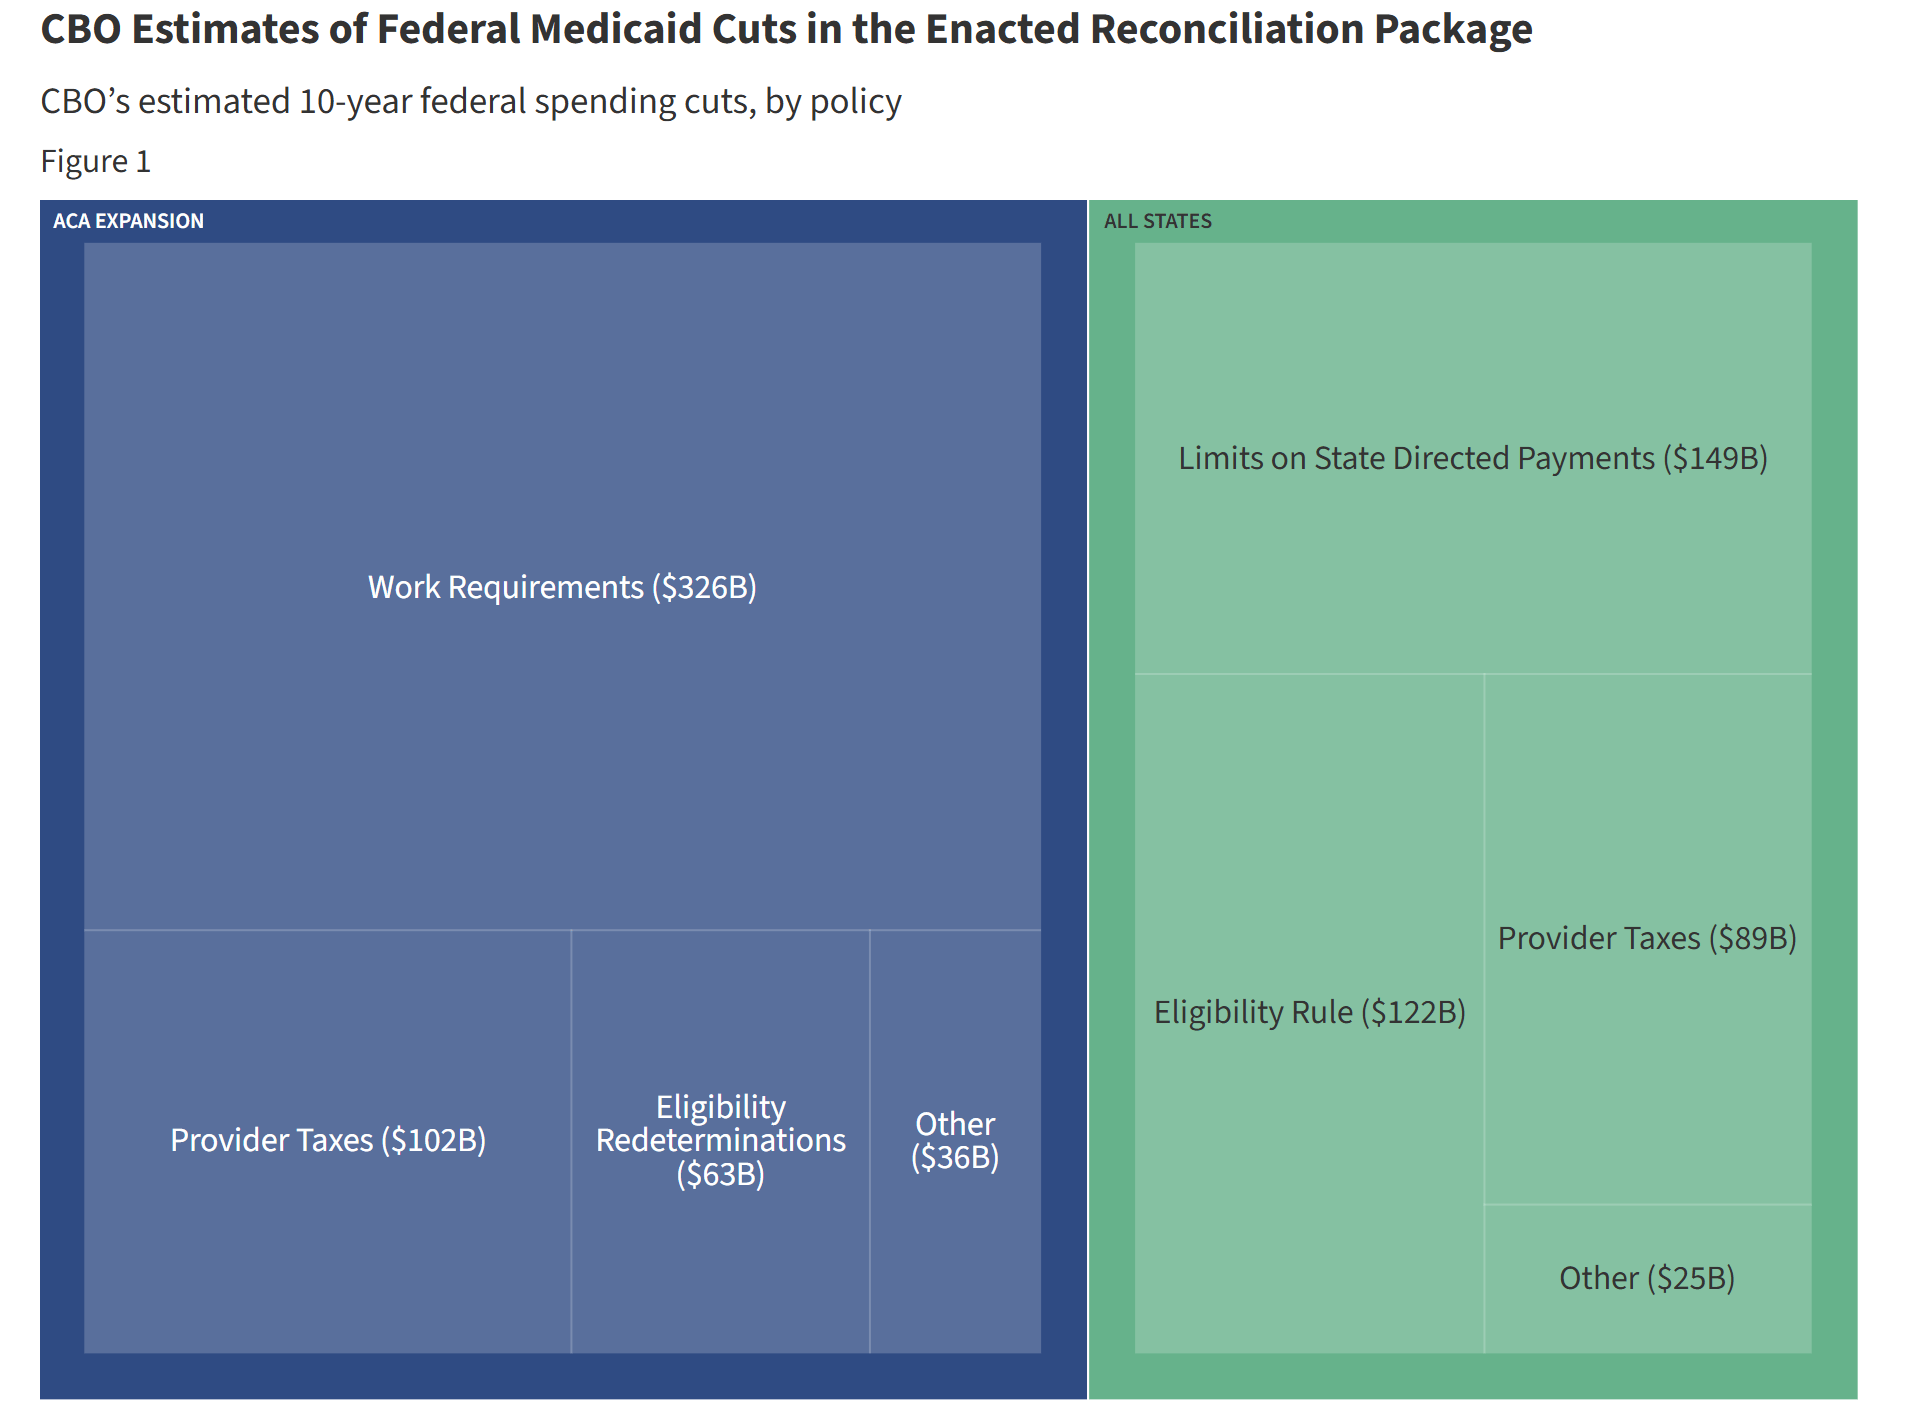
During Biden’s administration, government spending and transfer payments continuously injected liquidity into the economy. But under the “Big Beautiful Bill,” spending growth is slowing.
This means the amount of money the government is injecting into the economy is decreasing.
Additionally, the government is extracting funds from the economy through tariffs.
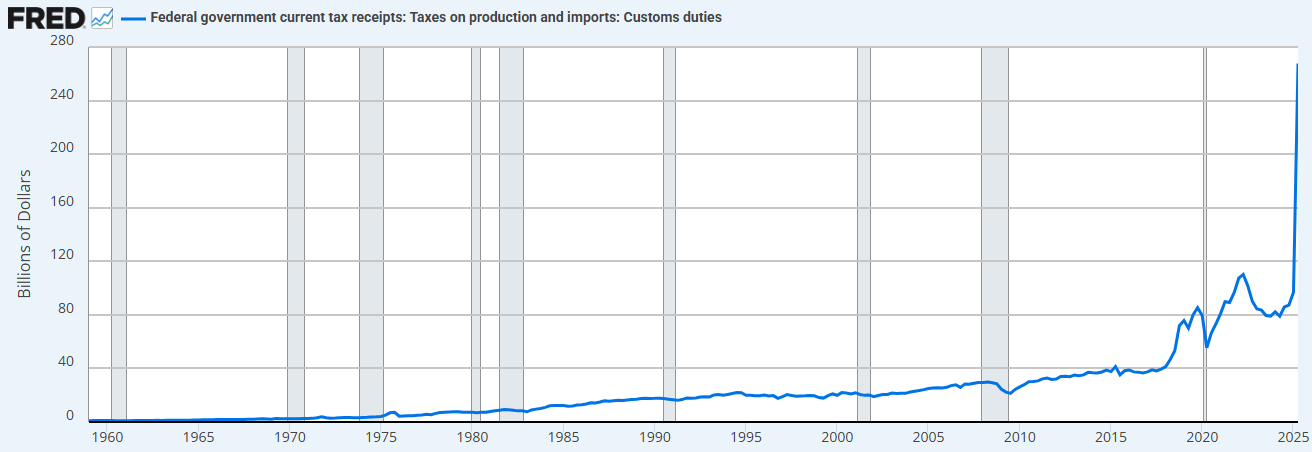
The combination of spending restrictions (relative to the previous administration) and increased tariffs means the Treasury is now absorbing liquidity rather than supplying it.
This is why we need rate cuts.
“We will re-privatize the economy, revitalize the private sector, and shrink the government sector.” - Scott Bessent
2. “Treasury QE.” To fund the excessive Treasury spending during the Biden administration, we also saw a new form of “quantitative easing” (QE). We can observe this below (black line). “Treasury QE” funded government spending via short-term bills rather than long-term bonds, thereby supporting the market.
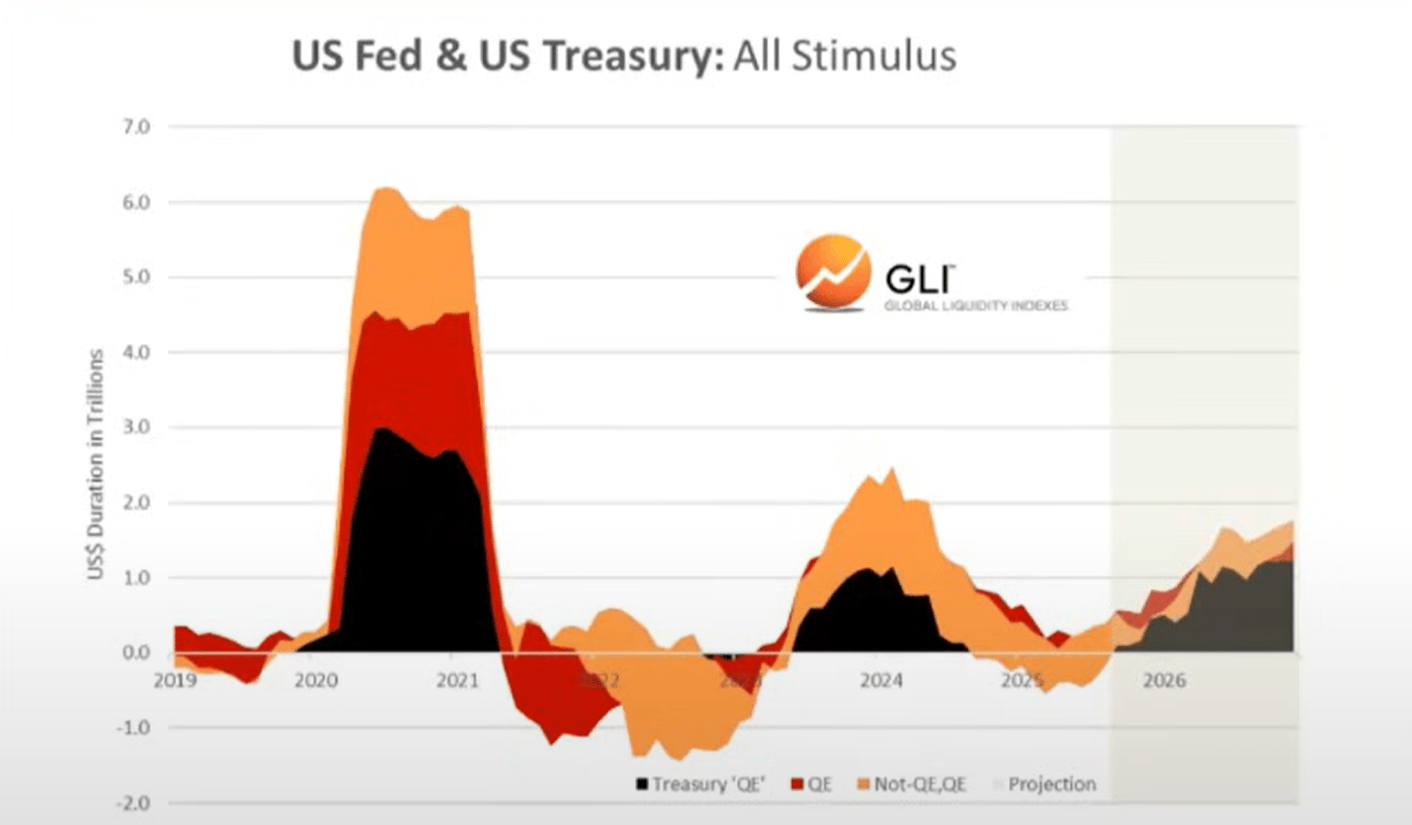
We believe it was fiscal spending and Treasury QE that drove the “devaluation trade” and the “everything bubble” we have seen in recent years.
But now we are transitioning to the “Trump economy,” with the private sector taking the baton from the Treasury.
Again, this is why they need to cut rates—to jumpstart the private sector through bank lending.
As we enter this transition period, the global liquidity cycle appears to be peaking…
The Global Liquidity Cycle Is Peaking and Rolling Over
The Current Cycle vs. the Average Cycle
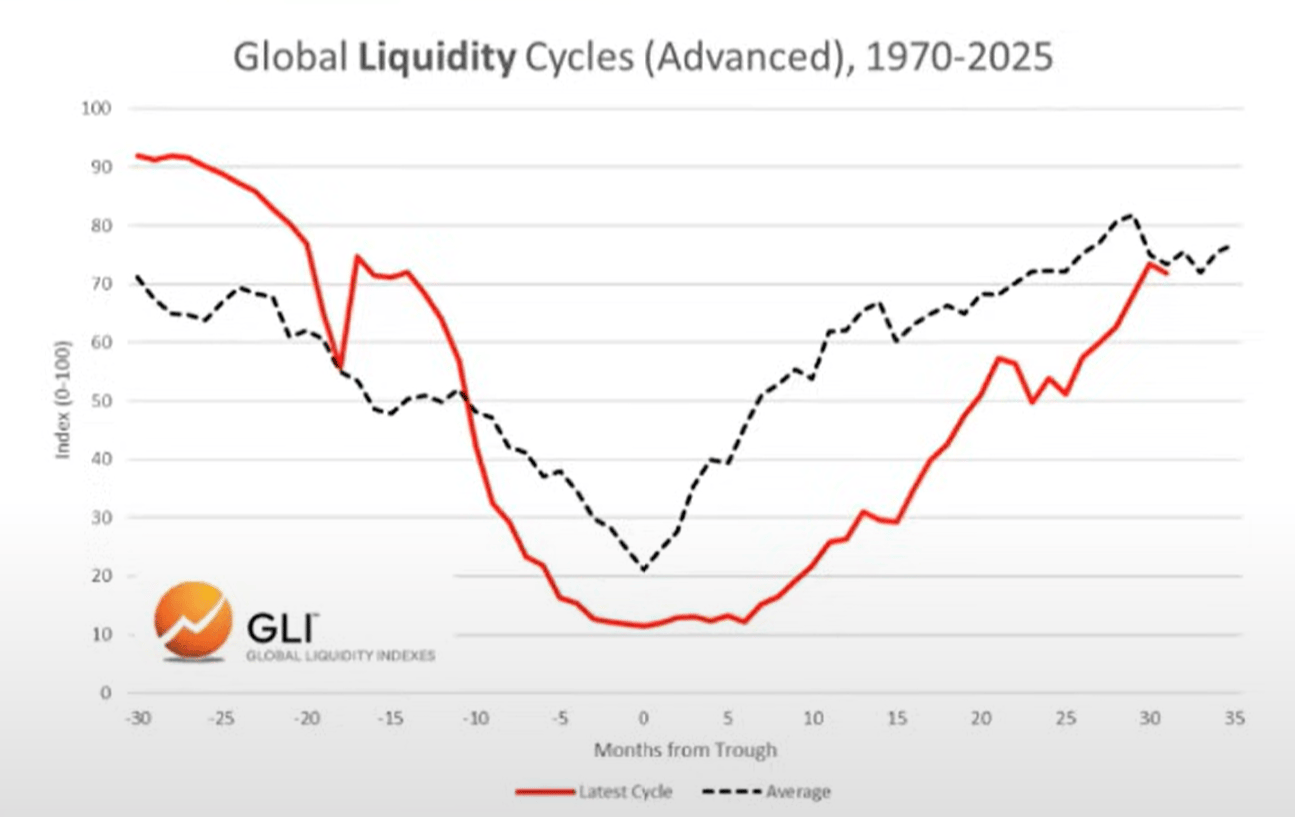
Below, we can observe a comparison between the current cycle (red line) and the historical average cycle since 1970 (gray line).
Asset Allocation
Based on Mr. Howell’s work on the Global Liquidity Index, we can observe a typical liquidity cycle and its alignment with asset allocation.
Commodities tend to be the last assets to fall, which is exactly what we are seeing today (gold, silver, copper, palladium).
From this perspective, the current cycle looks very typical.
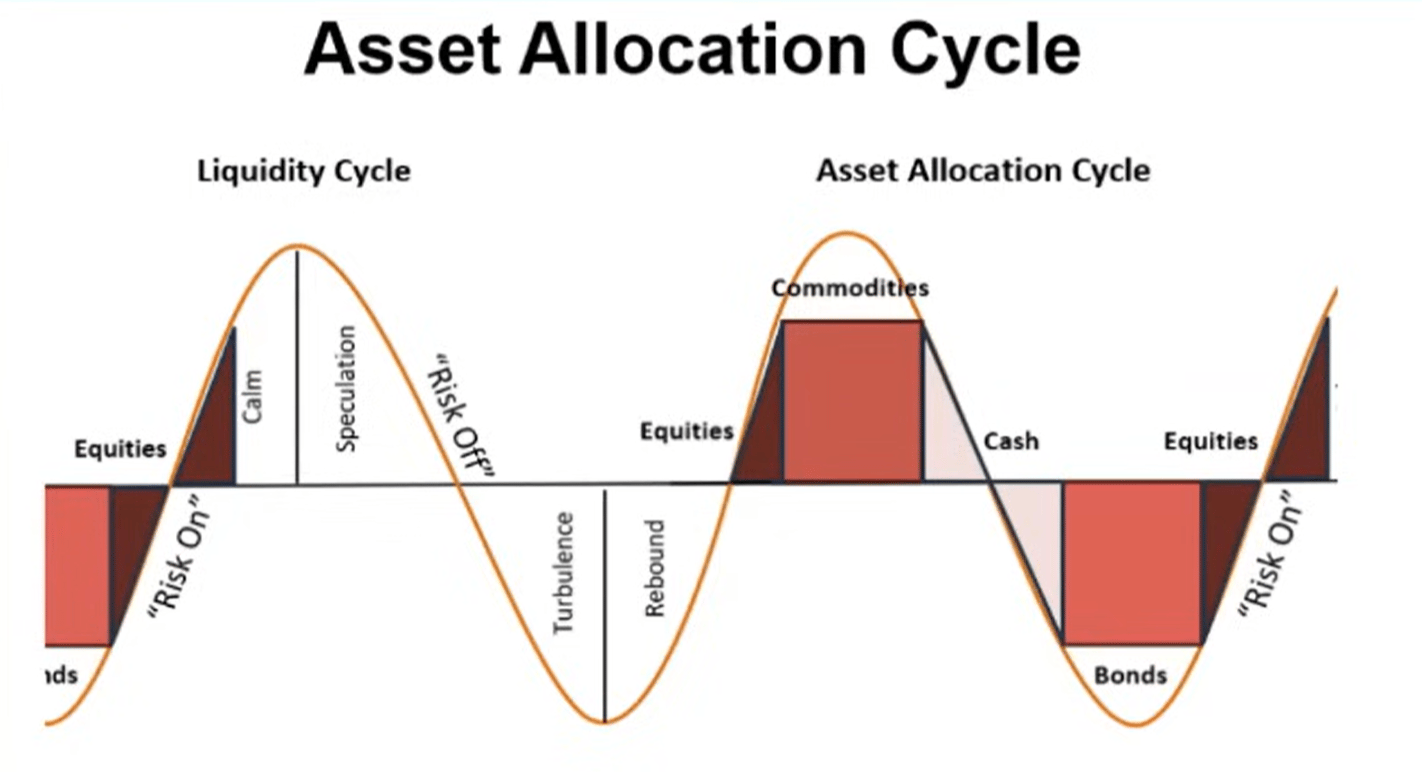
So. If liquidity is indeed peaking, we expect investors to rotate into cash and bonds as the environment changes. To be clear, this part of the process has not yet begun (the market is still “risk-on”).
Debt and Liquidity
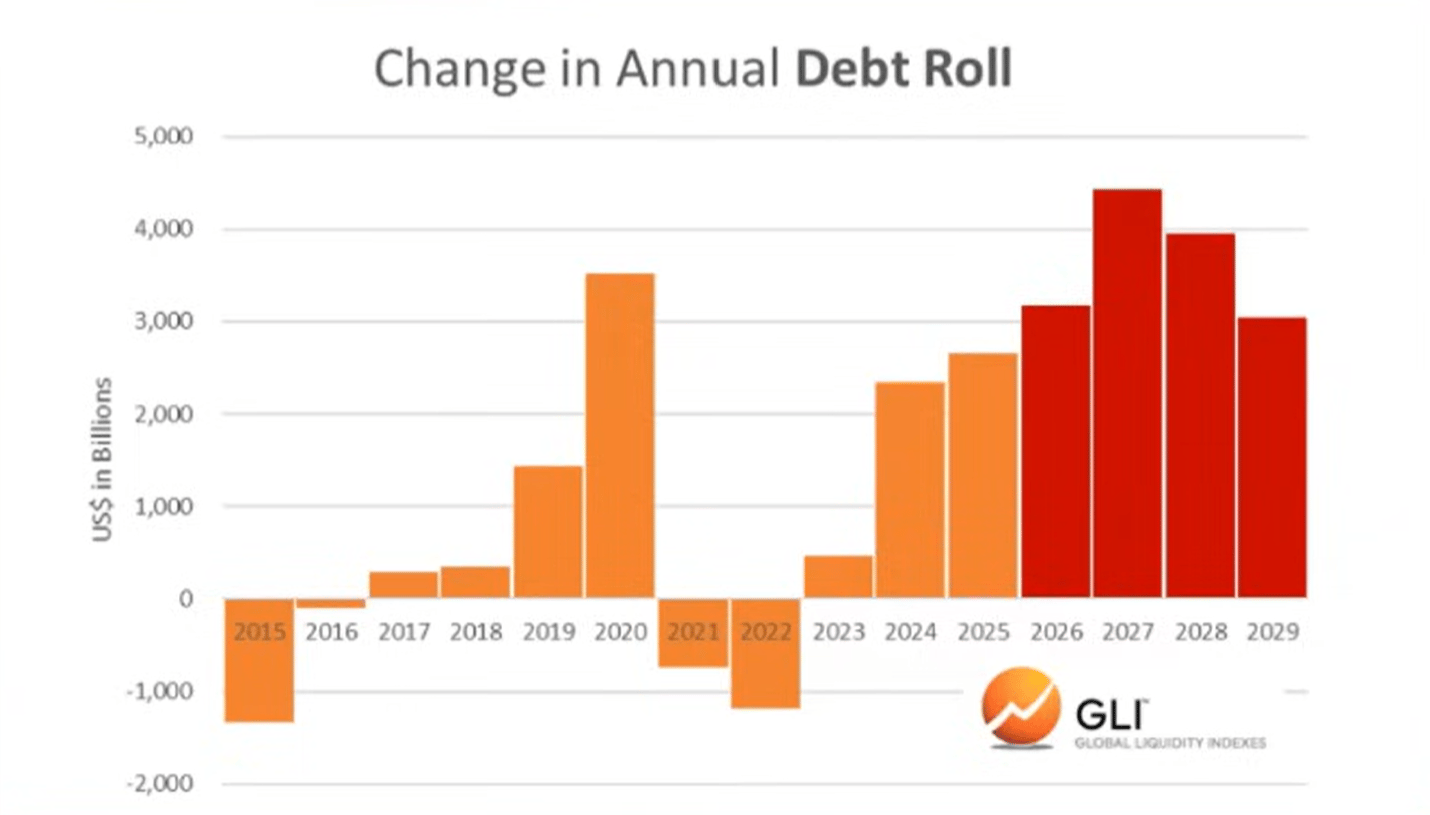
According to the Global Liquidity Index, the debt-to-liquidity ratio of major economies reached its lowest level since 1980 at the end of last year. It is now rising and is expected to continue climbing through 2026.
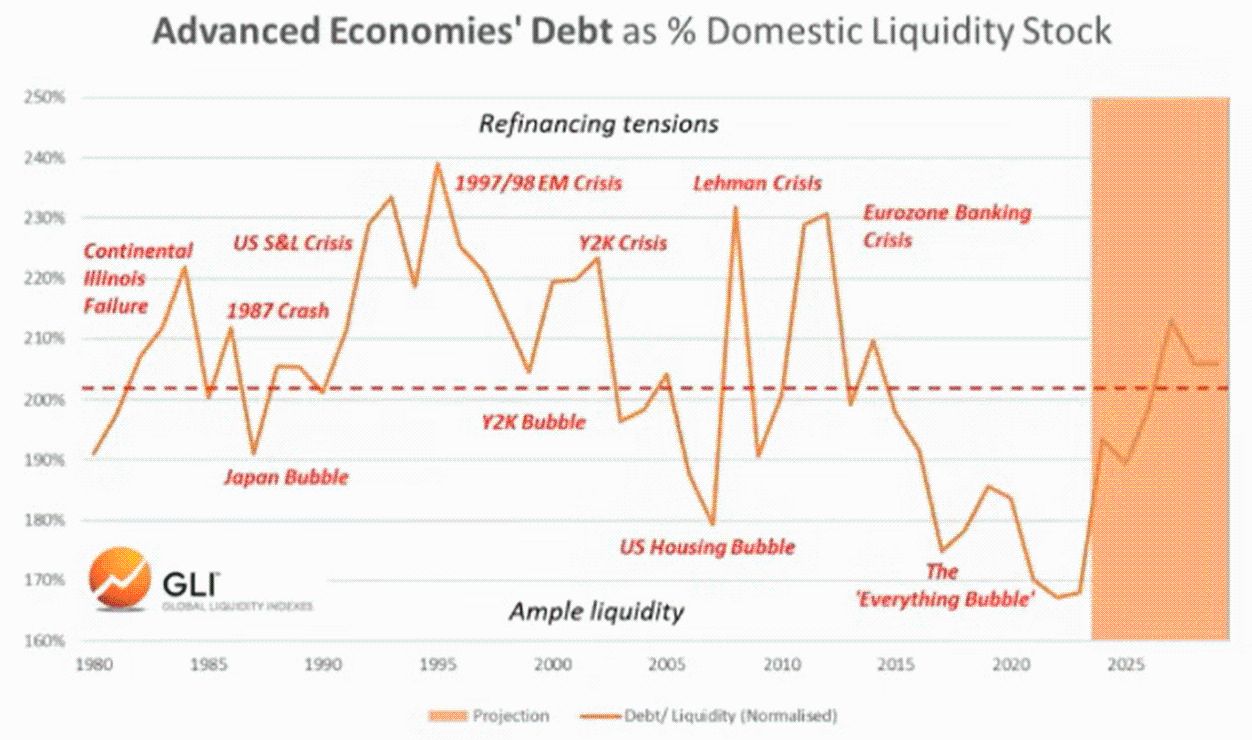
The rising debt-to-liquidity ratio makes it increasingly difficult to service trillions of dollars in outstanding debt that needs refinancing.
Bitcoin and Global Liquidity
Of course, bitcoin has “signaled” the peak in global liquidity in the past two cycles. In other words, bitcoin peaked a few months before liquidity rolled over, seemingly anticipating the subsequent decline.
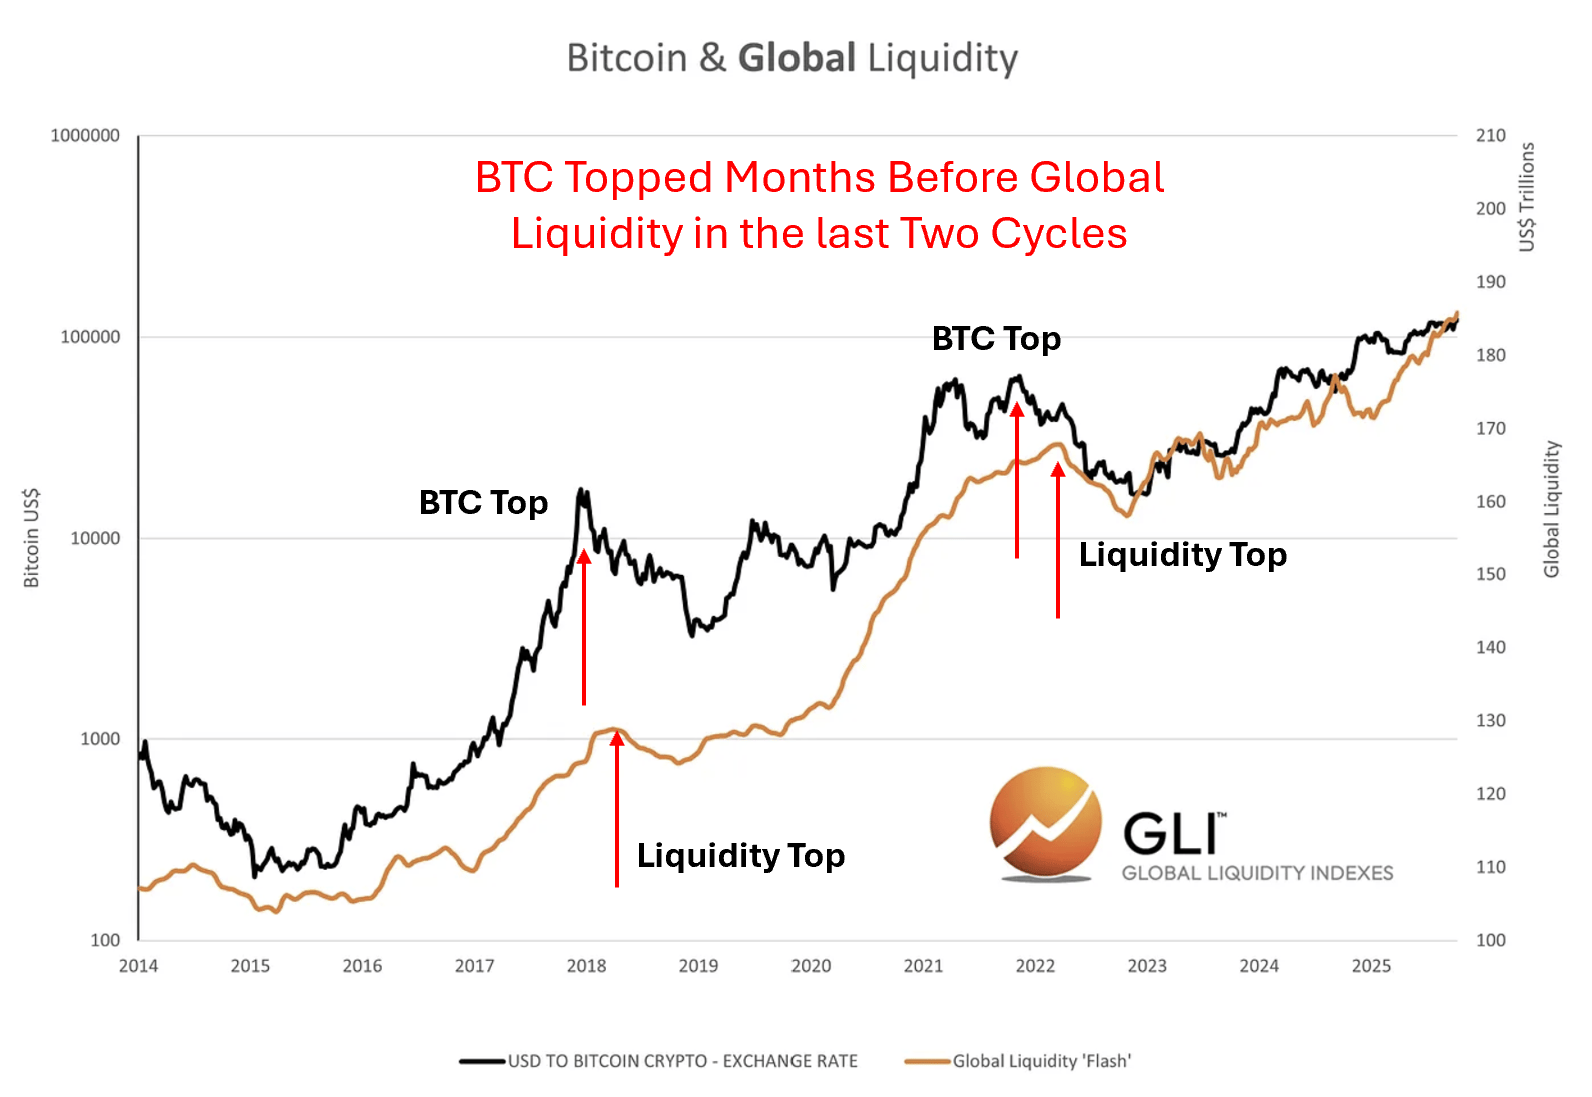
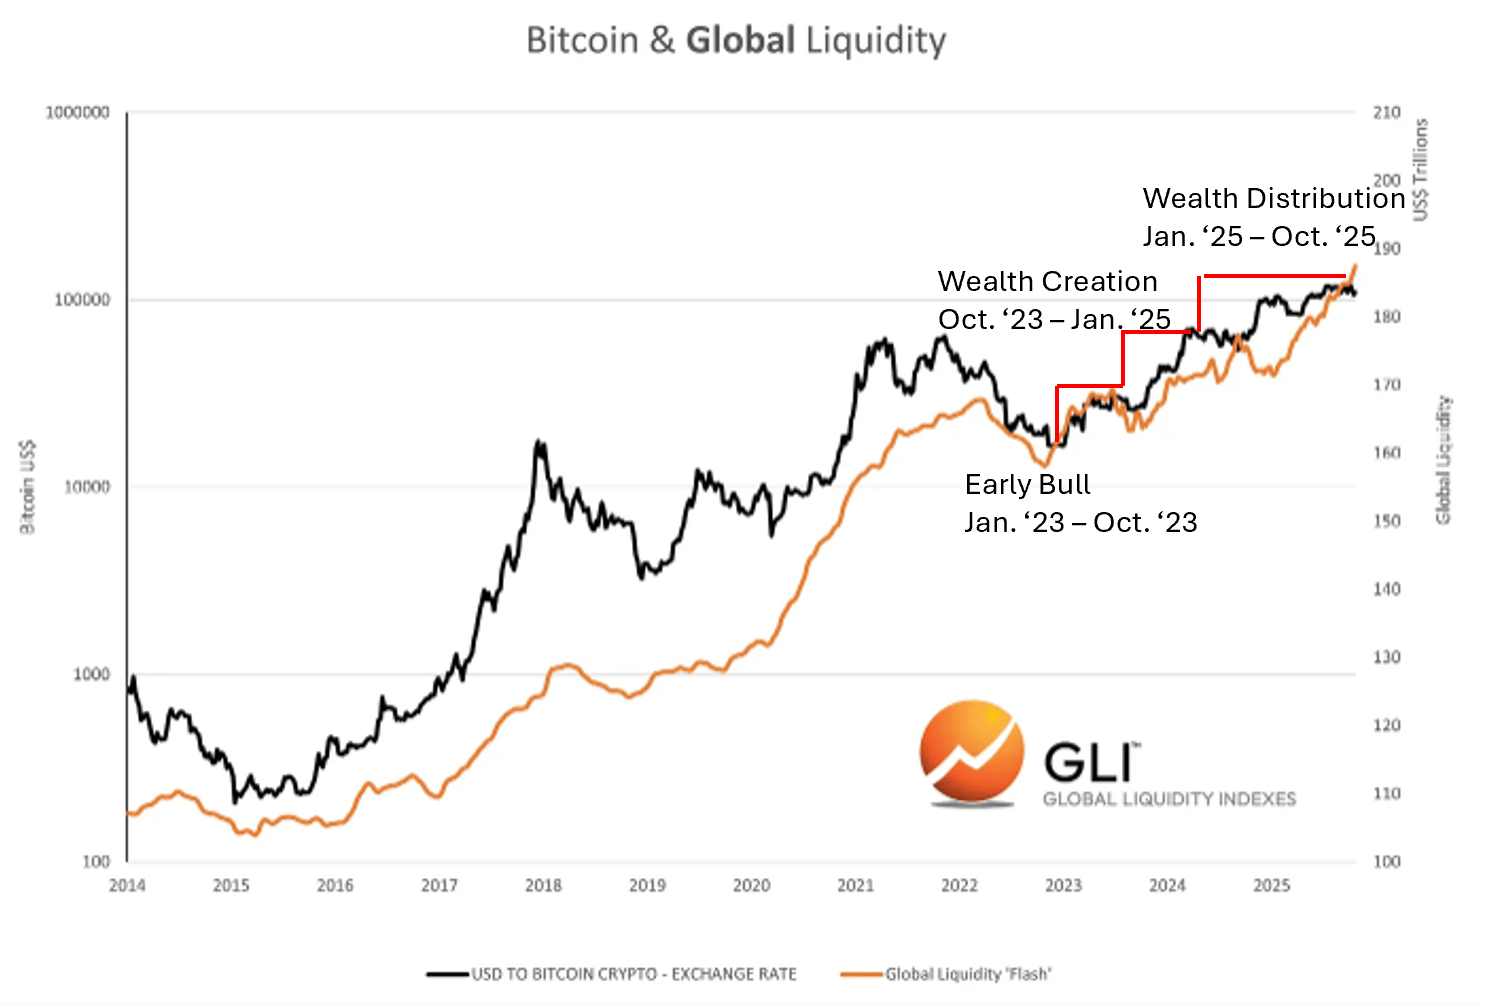
We don’t know if this is happening right now. But we do know that the crypto cycle has always closely followed the liquidity cycle.
Alignment with the Crypto Cycle
Disclaimer: The content of this article solely reflects the author's opinion and does not represent the platform in any capacity. This article is not intended to serve as a reference for making investment decisions.
You may also like
Japanese Finance Minister Reiterates Concerns: Yen Undervaluation is a "Big Problem," Will Cooperate Closely with the US to Maintain Forex Market Stability
Japanese Finance Minister Masato KATAYAMA stated that the weakness of the yen remains an ongoing concern. Japan and the United States will continue to maintain close contact in order to seek orderly functioning of the foreign exchange market.
Gold bounces off eight-week low; not out of the woods amid rising Fed hike bets
The "Endgame" of De-globalization: A Historic Battle for Metals!

Consulting giant Bain sounds the alarm: The global AI industry needs to achieve $6 trillion in annual revenue to sustain the “cash burn” of data centers
Bain stated that by 2031, the global artificial intelligence (AI) industry needs to achieve annual revenue of $6 trillion in order to justify the massive capital investment currently being made in building data centers worldwide.
Crypto prices
More


