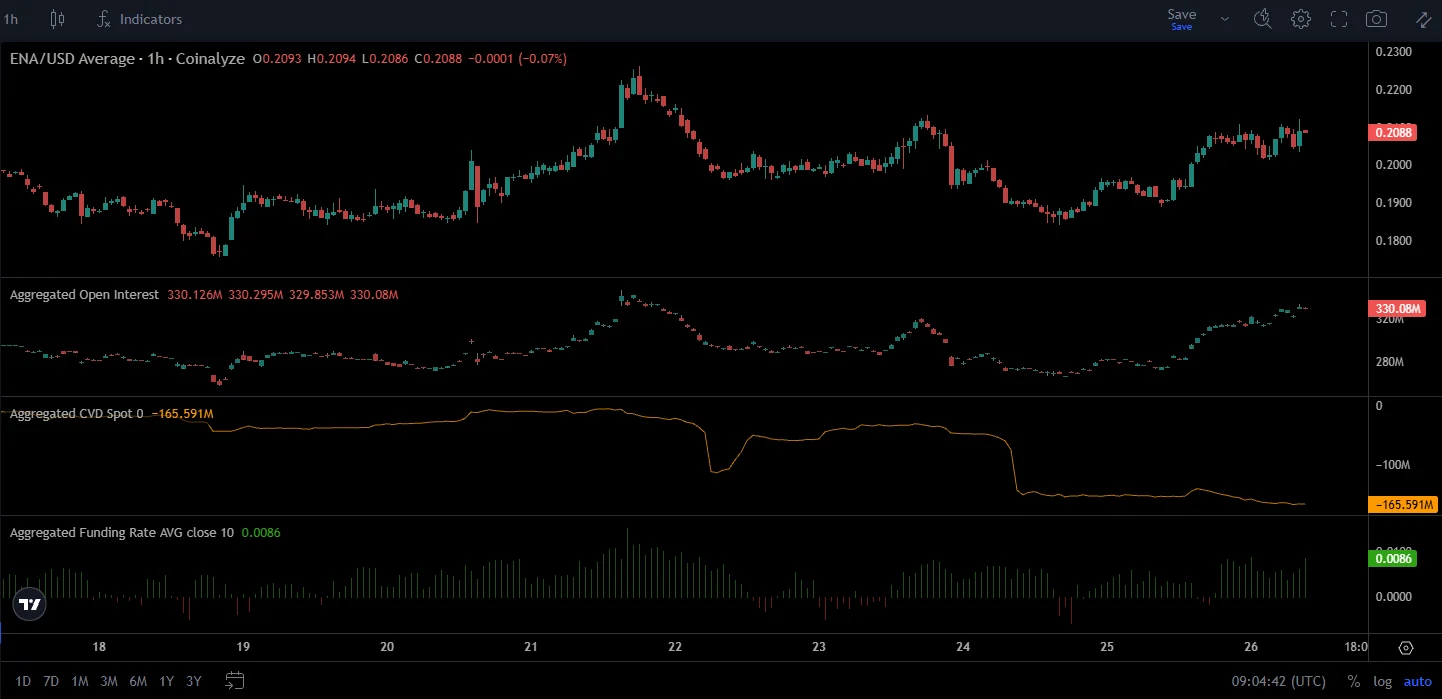
Ethena [ENA] has shown relative bullish strength against major large-cap altcoins. The crypto has rallied by 8.66% in the past 24 hours, compared to Bitcoin’s [BTC] 0.16% gain and the altcoin sector’s 0.40% move higher.
The Open Interest behind Ethena in perpetuals markets has increased by 15.30%. Yet, the Spot CVD remained in a stubborn downtrend in recent hours, a signal from Coinalyze data that Spot demand was relatively weak.
The Funding Rates were positive, too, showing market participants maintained a bullish view overall. Recently, it was reported that a $1 billion buyback could fuel an ENA charge back above $0.30.
In recent weeks, Ethena has seen a downward price slide alongside the wider crypto market but maintained a bullish longer-term bias.
The September rally shifted the long-term ENA bias
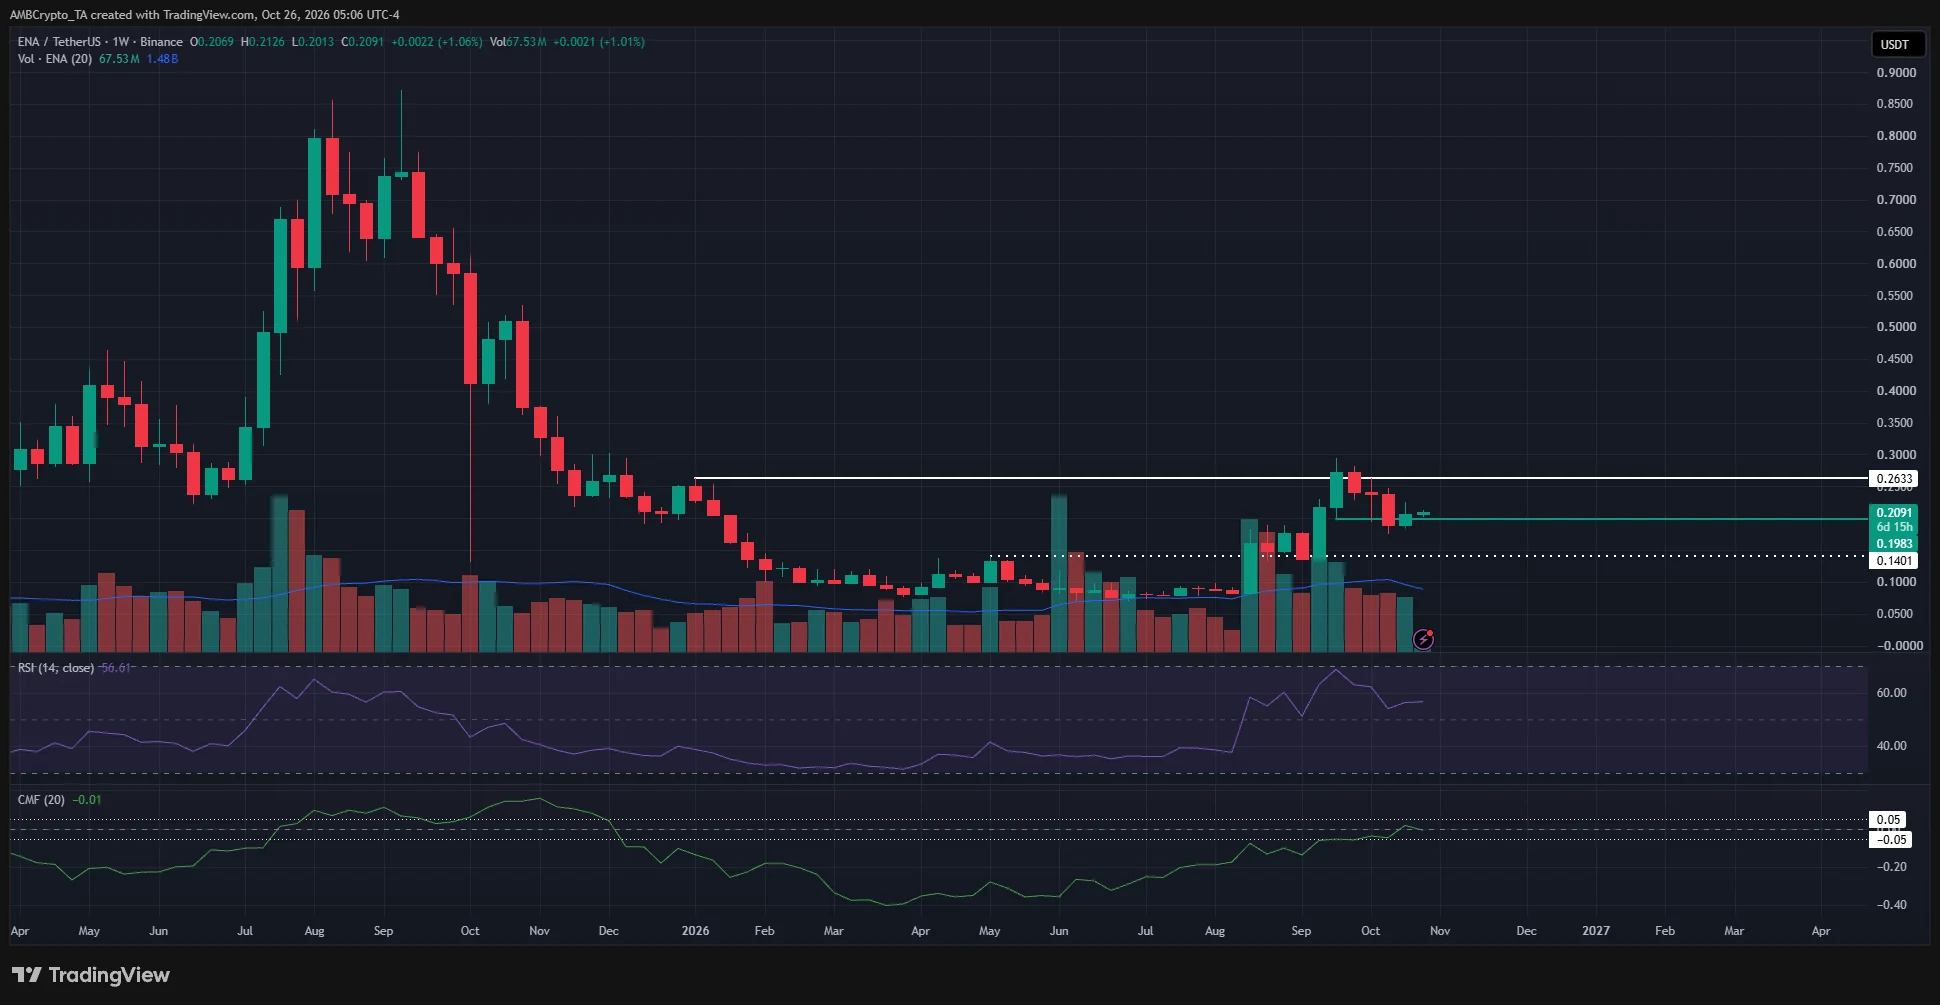
The weekly swing structure flipped bullishly when the $0.263 swing high from December 2025 was breached in September. A weekly session close above it, despite the drawdown since then, confirmed a structure break.
Despite recent losses, the RSI remained above neutral 50. The CMF was yet to climb past +0.05 but has recovered from the deeply seller-dominated trends that were in place for most of 2026.
The $0.263 and $0.140 support levels are the key levels for long-term investors to watch.
Traders’ call to action – Wait for a bullish reaction
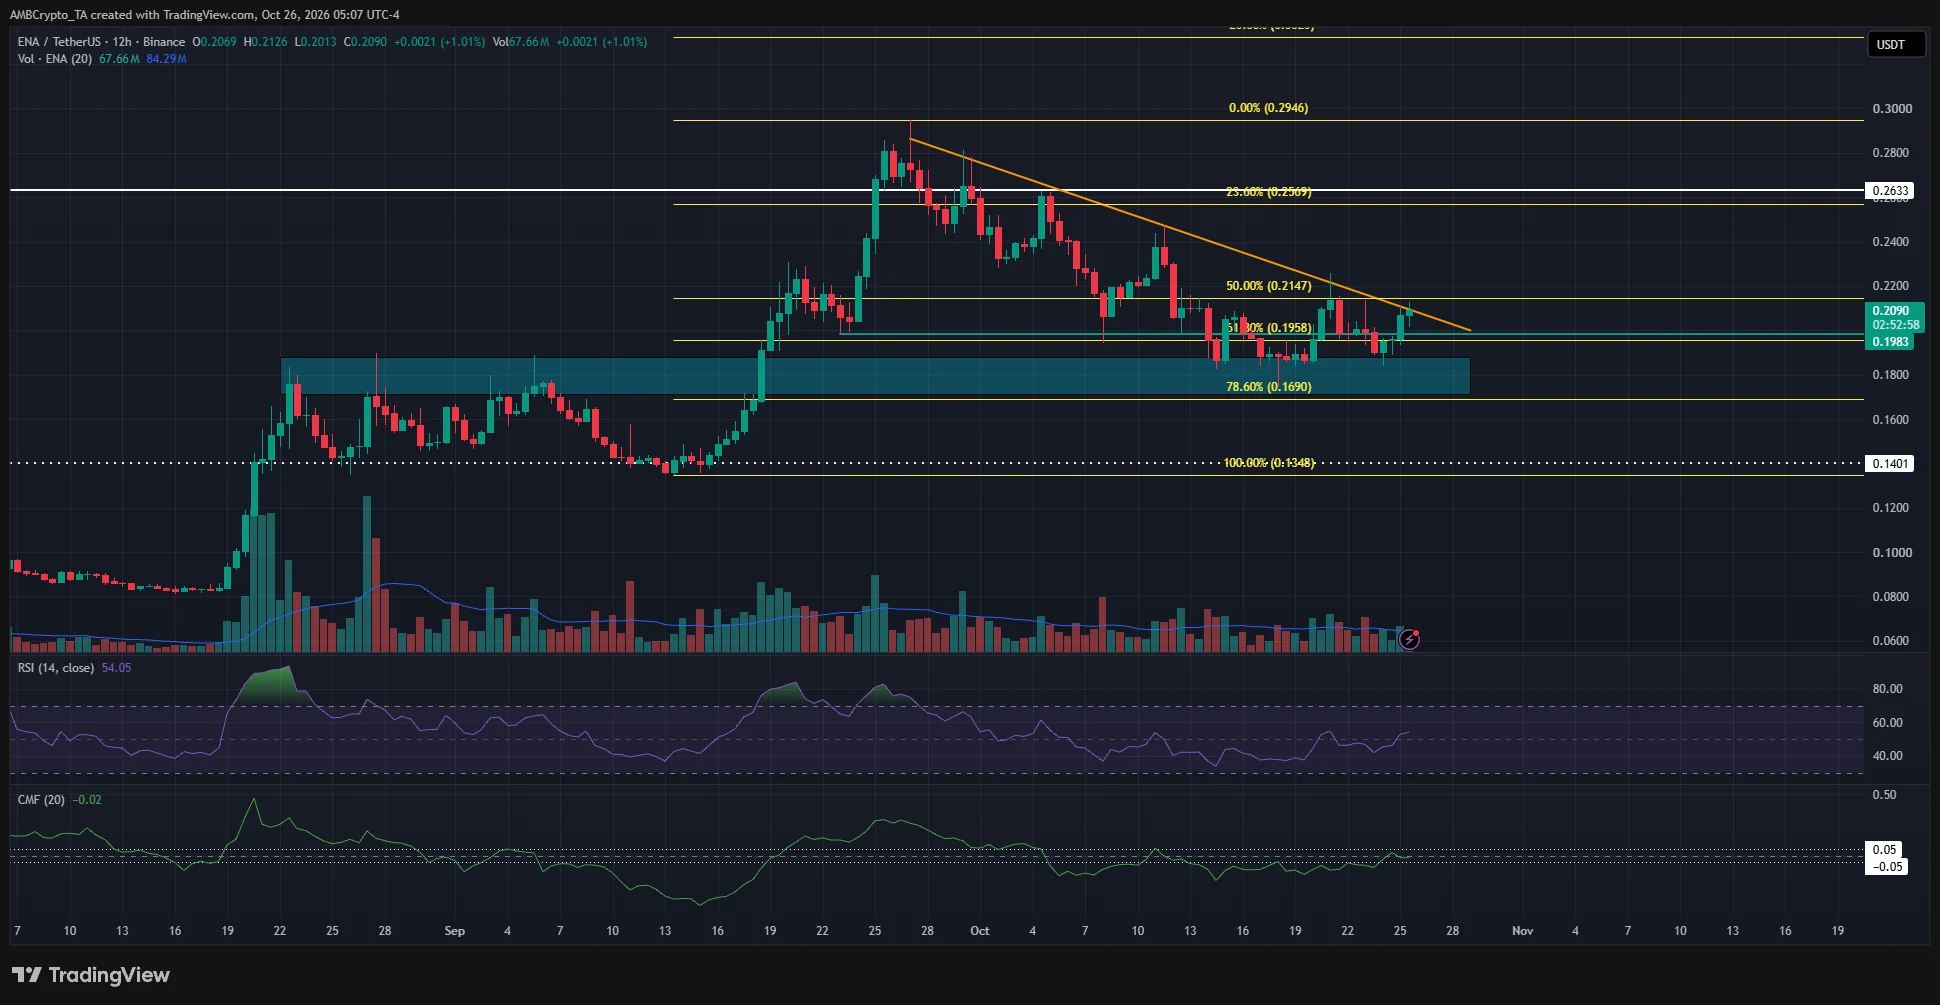
Since making local highs at $0.294, Ethena has been in a decline on the price charts. The descending trendline resistance (orange) on the 4-hour chart captured the downtrend.
The Fibonacci retracement levels highlighted $0.169 as a key support. Meanwhile, the $0.171-$0.187 demand zone from late August also added confluence for a bullish price reaction.
Swing traders can wait for a price reaction from this area, preferably in the form of a trendline resistance break, before buying. On the other hand, a 4-hour trading session close below $0.169 would be a warning sign of further drawdown.
Final Summary
- Ethena was one of the best-performing altcoins for the day in the top 40 crypto assets by market capitalization, with nearly 9% gains in the past 24 hours.
- The altcoin was in a retracement phase and testing a pivotal demand zone that stretched down to $0.169.