
Learning from history: gold is still bottoming out, is the countdown underway for the next explosive rally?

Jordan Roy-Byrne, author of "Gold & Silver: The Greatest Bull Market in History Has Begun" and a technical analyst, wrote on Wednesday that the gold bull market is still in its early stages.
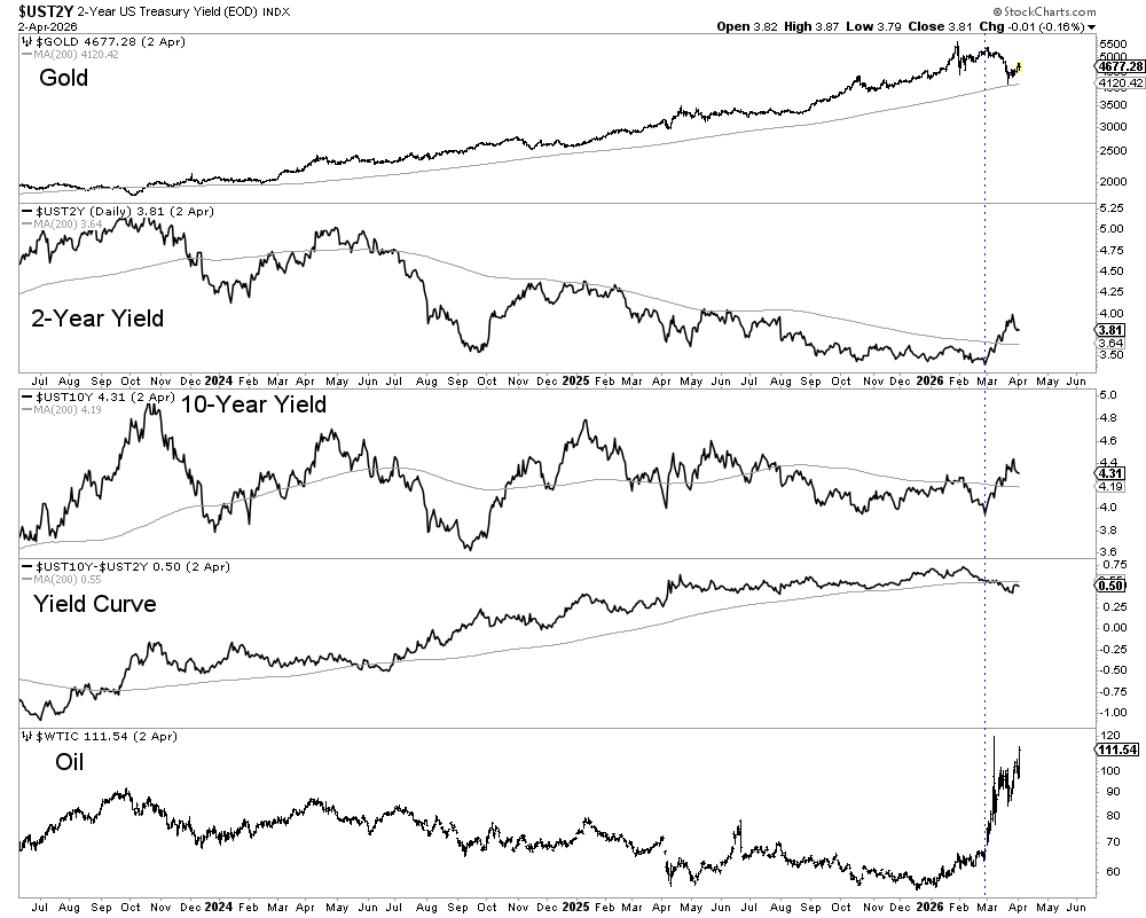
After experiencing the second-largest breakout in history in March 2024, the gold market has seen its first substantial pullback.
For many investors, a significant drop after a large rally can be unsettling. In long-term bull markets, however, pullbacks are not only normal but also an essential part of the process.
Jordan points out that history shows this gold pullback may only be a brief consolidation before the next major surge. By reviewing past breakout trends, market cycles, and macroeconomic conditions, we can anticipate potential movements for gold and silver in the coming years.
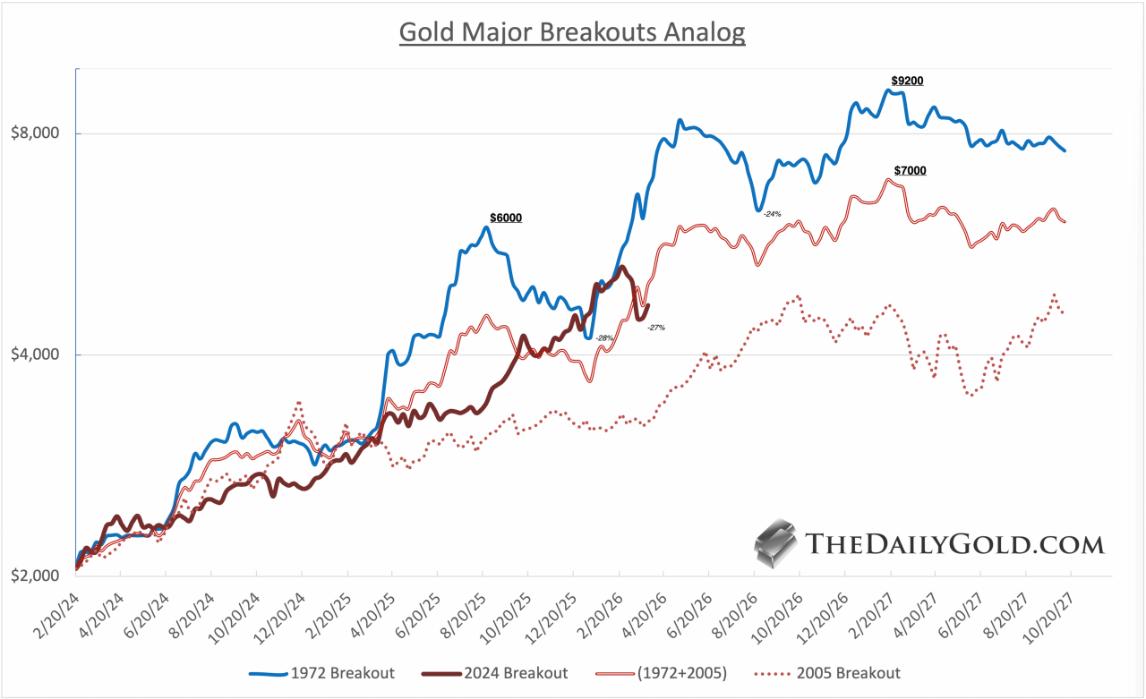
Historic Gold Breakout and Its First Pullback
According to Jordan’s analysis, gold is currently undergoing its first medium-term adjustment since a major breakout about two years ago. Historically, similar breakout periods have driven precious metals into some of their strongest multi-year rallies.
Two historical comparisons stand out: the breakout events in 1973 and 2024. In both periods, gold prices kicked off a strong two-year advance.
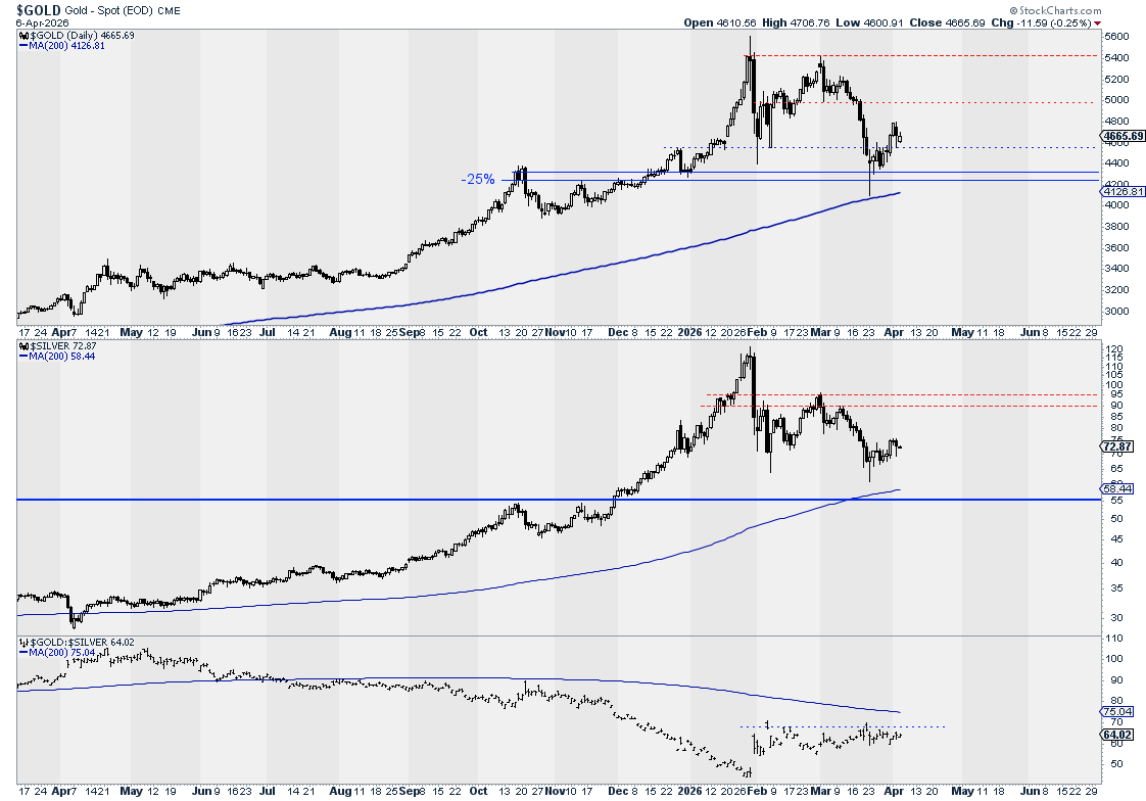
In the 1973 cycle, gold saw a steep rally (with a magnitude comparable to the current surge that brought prices near $6,000), then peaked, followed by a 28% pullback.
This pullback is strikingly similar, with gold prices down roughly 27% so far. The decline matches historical precedent, but the timing suggests the pullback is not yet complete.
Looking at longer-term historical analogs (including the 2005 breakout), gold’s trajectory still points toward a potential target of $7,000 by 2027.
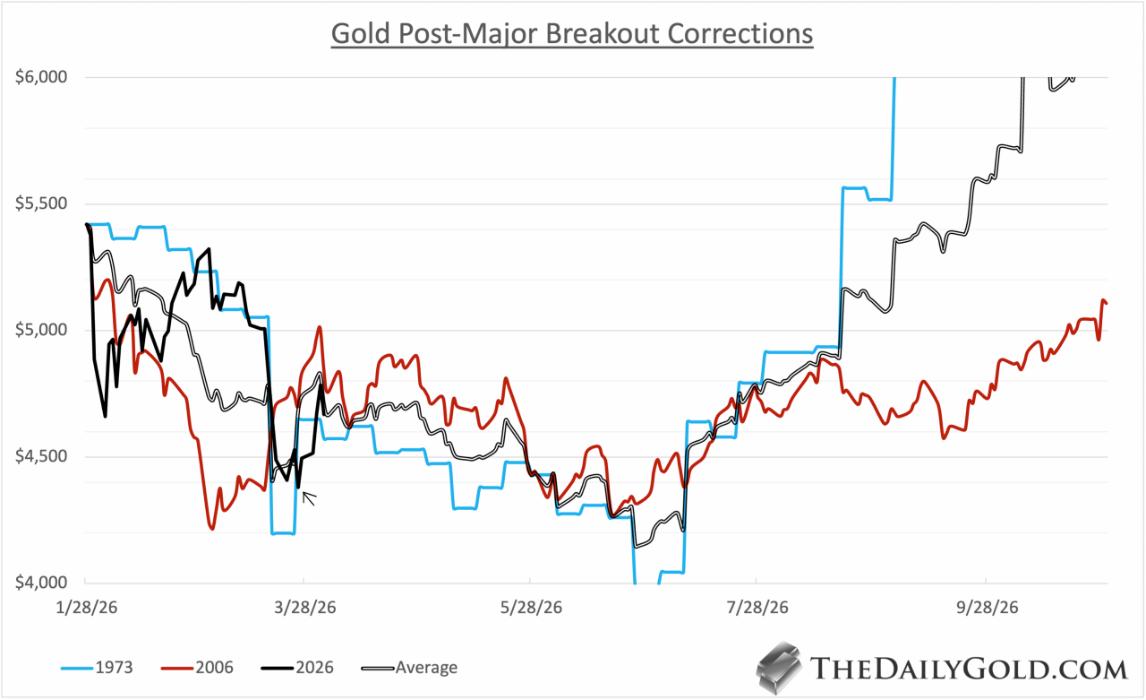
Understanding Post-Breakout Pullback Patterns
Jordan states that major gold breakouts usually follow a set pattern: breakout; rapid surge; medium-term pullback; bottoming near the 200-day moving average.
There are two key historical references here:
1973: Gold retraced 28% in about 5 months;
2006: Gold retraced 25% in about 5 months.
Jordan notes that the current pullback closely matches these cycles. The probability is high that the first leg of the drop is over. Notably, the timing of the current first-stage low nearly coincides with the 1973 pullback low, only a few days later than the historical average.
If this pattern continues, gold may now be entering a phase of weak consolidation that lasts another 2 to 3 months, after which this pullback phase would be complete.
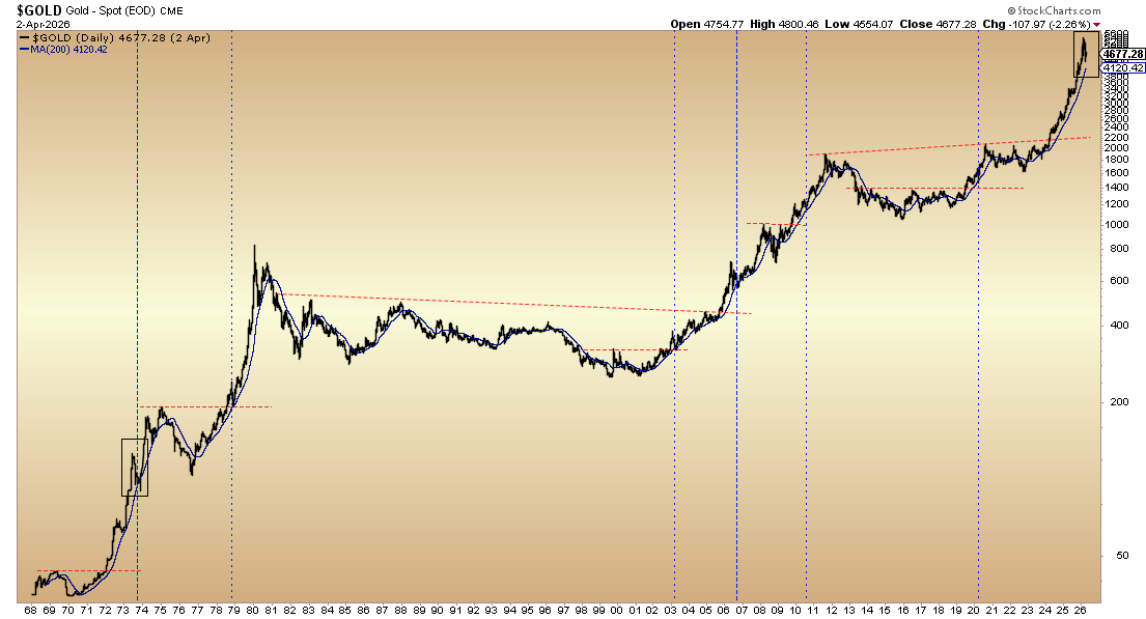
The Importance of the 200-Day Moving Average
According to Jordan, after major breakouts, gold often retests this level before another rally begins. This test serves as the “reset point” for the market: momentum cools here, allowing fresh buyers to enter.
Gold futures briefly touched the 200-day moving average, and spot prices have neared it as well. Candlestick closing charts can sometimes obscure these tests, as intraday swings are not fully captured.
As the 200-day moving average continues climbing and gold prices likely maintain a weak consolidation through spring, gold may complete its current adjustment with a clear test of this support level.
Notably, before finally bottoming in both 1973 and 2006, gold actually broke below the 200-day moving average for several weeks.
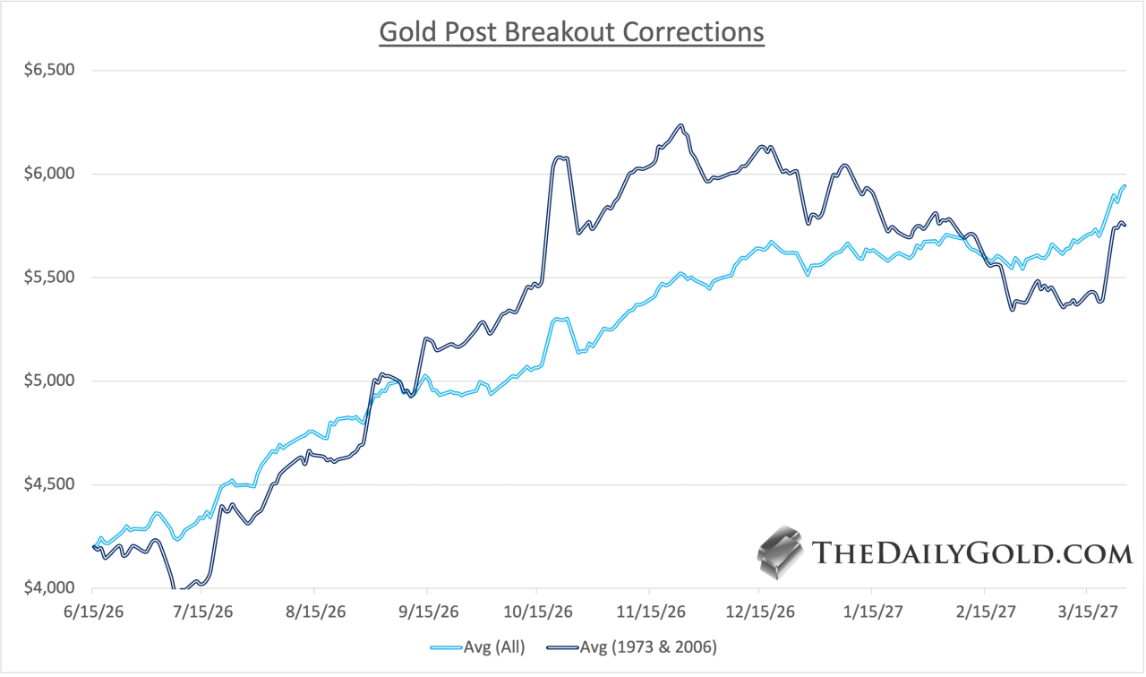
What Happens After the Pullback Ends?
Jordan says, history shows that once gold has completed its retest of the 200-day moving average after a breakout, the next phase of the bull market starts.
When comparing post-pullback rebounds, two sets of historical averages are useful:
The pullbacks of 1973 and 2006;
Broader samples including the pullbacks of 1978, 2003, 2010, and 2020.
Of these, the 1973 and 2006 patterns are most relevant to the current cycle. According to these models, once the pullback ends, gold can resume its long-term rally, with significant upside potential.
The following chart assumes a gold bottom of $4,200 in mid-June. Based on the average post-pullback rise in 1973 and 2006, prices could reach $6,000 per ounce by October 2026.
Macro Environment: The Inflation vs. Recession Tug-of-War
Jordan believes technical charts and price patterns are important, but macro market conditions also profoundly impact gold’s trajectory.
The current macro transmission chain is roughly: rising oil prices → higher bond yields → rising inflation expectations → Federal Reserve tightening policy (at this stage).
Although this environment puts temporary pressure on gold, once market narratives shift from inflation worries to recession fears, the landscape changes.Historically, this turning point often signals the start of the next major rally for gold and the entire precious metals sector.
Silver’s Role in the Cycle
In large-scale precious metals cycles, silver’s trend can sometimes diverge from gold’s.
After a suspected blow-off move (very similar to 1974 and 2006), silver has again underperformed gold.
Jordan highlights several key observations: the gold/silver ratio shows a bullish consolidation pattern; the expected target for the ratio is about 77; silver has strong price support near $55; and the 200-day moving average (around $58) is trending higher.
Jordan believes, in the short term, silver may continue to lag gold. However, once gold breaks through $5,200–$5,400, silver is likely to reach its inflection point.
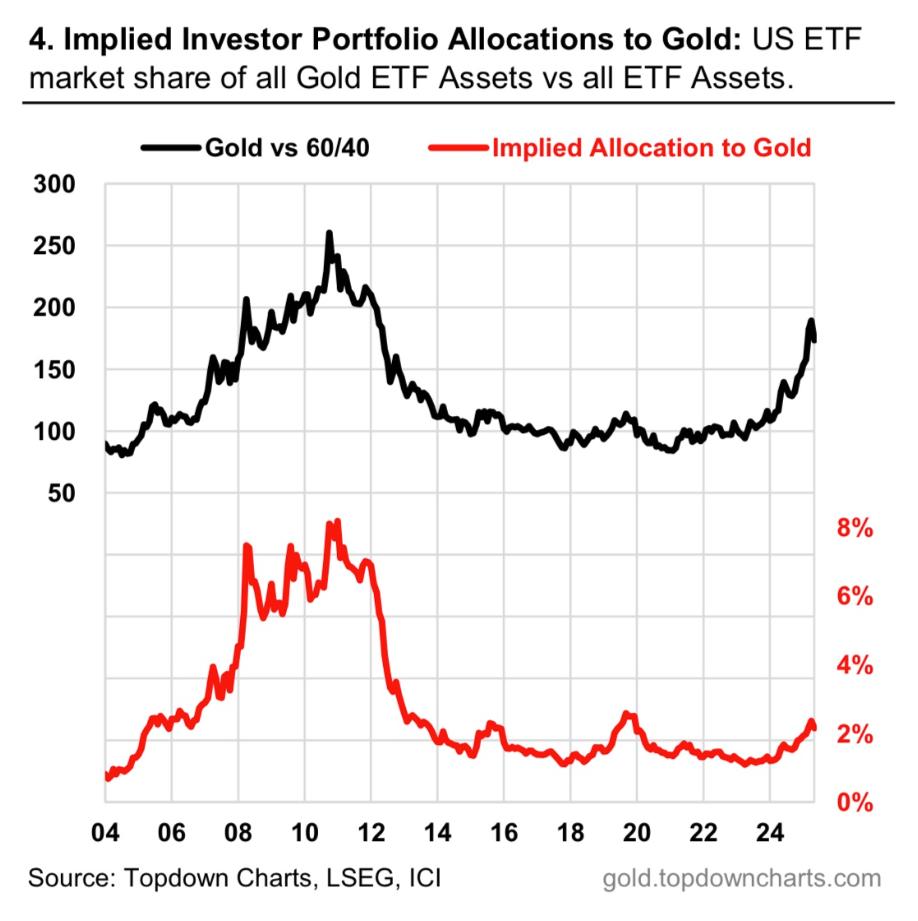
Long-term Gold Allocation Remains Severely Low
Jordan says one of the most notable features of the current bull market is extremely low institutional allocation to gold.
Comparisons to 2011, 1980, or 1979 don’t apply, as capital flows and allocations have looked very different in recent years.
Implied gold ETF allocation is still near 2%, below the 2019 peak, and much further below the 8% highs of 2008 and 2011.
Pullbacks like the current one often drive allocations even lower—thus building momentum for the next rally when investor sentiment flips.
Conclusion
In summary, Jordan believes the current gold pullback appears normal, healthy, and consistent with historical trends. Historical patterns suggest the market will experience several more months of consolidation before completing the correction, during which it will likely test—and briefly dip below—the 200-day moving average. Over the long term, gold could reach $7,000 by 2027. Silver may remain relatively weak short-term but has robust support in the $55-$60 range.
Jordan notes that for investors, these phases are often the best times to lay foundations for major positions. As sentiment cools and the market consolidates, thorough research and cautious portfolio structuring help investors prepare for the next leg of the precious metals bull market.
Disclaimer: The content of this article solely reflects the author's opinion and does not represent the platform in any capacity. This article is not intended to serve as a reference for making investment decisions.
You may also like

UMXM (Manadia) fluctuated by 42.5% in 24 hours: trading volume surge drives price rebound
ROLL (RollX) sees 48.7% volatility in 24 hours: coexistence of low liquidity fluctuations and active community