
US Treasury yields just started to rise but were suppressed again by the Hormuz issue; only 2 days left for the final showdown between gold bulls and bears

Huitong Network, April 9—— On Thursday (April 9), the global financial markets are at an extremely delicate tipping point. Although the previously reached fragile ceasefire agreement has temporarily suppressed some risk-aversion sentiment, the latest developments show that shipping safety concerns in the Strait of Hormuz are heating up again. Based on both fundamental and technical analysis, the main theme for market performance in the next 2-3 days will be "data-driven volatility correction".
On Thursday (April 9), the global financial markets are at an extremely delicate balance. Although the previously reached fragile ceasefire agreement has temporarily suppressed some risk aversion, the latest situations indicate that security concerns in the Strait of Hormuz have flared up again. Prominent institutions have pointed out that since the core geopolitical conflicts have not been fundamentally resolved, the current optimism in the market is quickly evaporating. Meanwhile, the latest FOMC minutes released by the Federal Reserve sent a clear hawkish signal, with the urgency of inflation control still higher than market’s earlier expectations. As a result,

US Treasuries and the Dollar: The Game Between Tightening Expectation and Safe Haven Support
According to the latest minutes, policymakers’ confidence in inflation returning to the 2% target has been shaken, and some officials suggested that further hikes are not ruled out if inflation remains off-target. This "tightening bias" provides underlying support for the
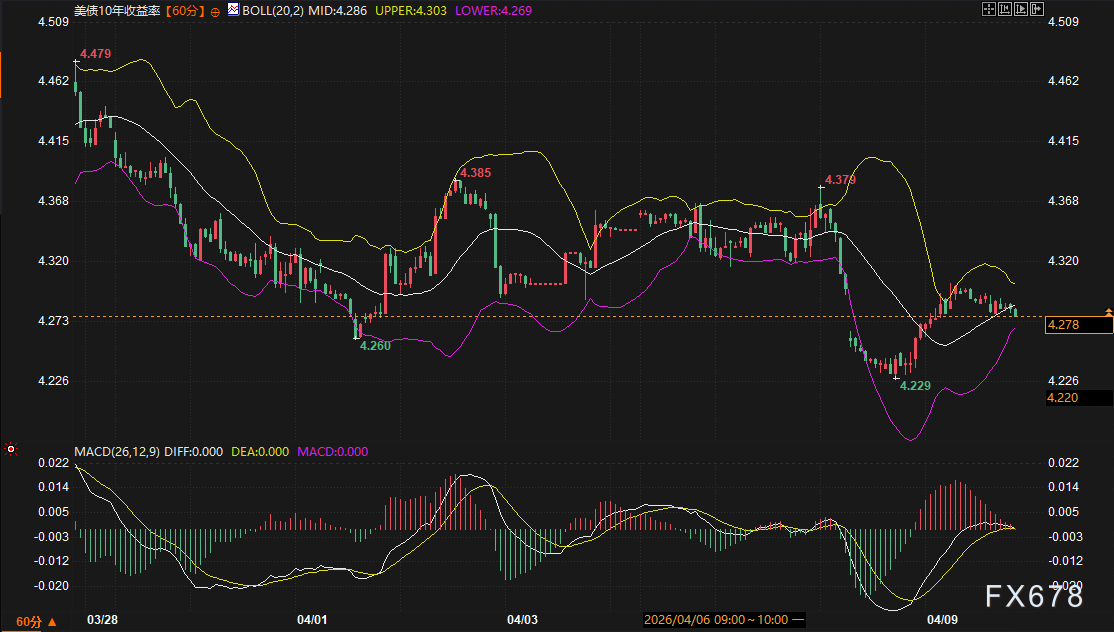
In the US Treasury market, the 10-year US Treasury yield is currently at 4.278% (UTC+8), running below the middle Bollinger Band. On the 60-minute chart, the MACD green bar continues to shrink, indicating a phase weakening of bearish momentum, but resistance near the middle band at 4.286% (UTC+8) remains significant. Leading institutions believe US Treasury yields show strong two-way fluctuation between 4.27% and 4.32% (UTC+8). Considering the upcoming Initial Jobless Claims and February Core PCE Price Index, if the data confirms economic resilience and core inflation remains high at 0.4%, yields may once again test the resistance band at 4.30%–4.35% (UTC+8). Conversely, if geopolitical risks escalate further, safe haven buying may push yields down to the support level near 4.23% (UTC+8).
Spot Gold: Technical Correction After a High-Level Pullback
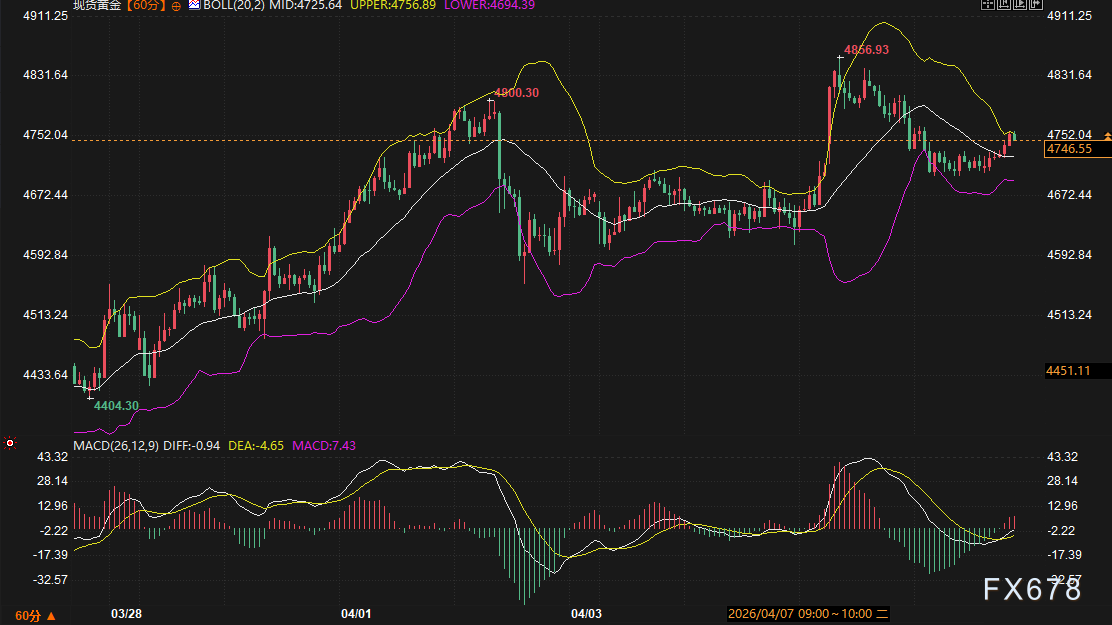
Currently, the support range is $4,695—$4,725 (UTC+8), while the resistance interval is concentrated at $4,757—$4,800 (UTC+8). Despite underlying safe haven demand driven by potential deterioration in the geopolitical situation, hawkish Fed tone and possible pressure from Core PCE data limit the space for gold to quickly return above $4,800 (UTC+8). Over the next 2-3 trading days, gold will likely fluctuate widely between $4,720—$4,780 (UTC+8), waiting for important economic data later this week for guidance.
Outlook
Based on comprehensive fundamental and technical analysis, the main market theme for the next 2-3 days will be "data-driven volatility correction". Geopolitical risk fluctuations will provide downside support for gold and the dollar, making it unlikely for asset prices to see a one-sided collapse. However, with the Core PCE Price Index expected to remain high, the Fed is unlikely to turn dovish in the short term, which forms a primary resistance for commodities to push higher.
It is expected that the
【Frequently Asked Questions】
The minutes showed that Fed officials are not satisfied with the pace of inflation cooling, reinforcing market expectations that "interest rates will remain higher for longer." This hawkish bias directly bolstered the dollar's underlying resilience while exerting opposite pressure on spot gold, causing gold prices to stall at high levels.
The market notes that despite the ceasefire, localized conflicts have not ceased, and threats to key shipping routes such as the Strait of Hormuz remain. This expectation of a "nominally effective ceasefire" makes it difficult for safe haven premiums to completely disappear, so after a brief pullback, assets still possess strong safe haven attributes.
Focus on Thursday’s release of weekly Initial Jobless Claims and the February Core PCE Price Index. As the Fed’s preferred inflation gauge, if the Core PCE remains at or above a 0.4% increase, it will significantly reinforce the dollar's rebound logic.
Currently, the first support is at $4,725 (UTC+8) (middle Bollinger Band), with the next at $4,694 (UTC+8) if broken. The first resistance is at $4,757 (UTC+8) (upper Bollinger Band), while the stronger resistance is at the key round number of $4,800 (UTC+8).
The main reason is the offsetting effects of multiple factors: on the one hand, upward pressure brought by hawkish Fed policy; on the other, downward momentum from safe haven buying in the face of geopolitical uncertainty. The balance of these forces keeps yields fluctuating in a narrow 4.23%–4.32% (UTC+8) range.
Disclaimer: The content of this article solely reflects the author's opinion and does not represent the platform in any capacity. This article is not intended to serve as a reference for making investment decisions.
You may also like
Elon Musk drops another bombshell! Three major changes at Tesla, is the stock price set to fall again?

IAG (Iagon) 24-hour fluctuation of 45.1%: Trading volume surges over $12 million, triggering intense volatility
BAN (Comedian) fluctuates 40.1% in 24 hours: driven mainly by massive buying and technical breakthroughs