
US-Iran tensions escalate, gold falls slightly

Huitong Network, April 14—— After the market opened on Monday (April 13), gold prices fell slightly, with upward momentum evidently limited due to the ongoing escalation of tensions between the US and Iran. Prices hovered around $4,737.61/oz intraday, down 0.26%, rebounding from an intraday low near $4,639.
After the opening on Monday (April 13), gold prices fell slightly, with upward momentum clearly limited due to the ongoing escalation of tensions between the US and Iran. During the session, prices hovered near $4,737.61/oz, a drop of 0.26%, rebounding from an intraday low of about $4,639.
The market is currently dominated by risk aversion sentiment. On April 12, peace talks between the US and Iran in Islamabad ended without result, with major disagreements on key issues such as the nuclear dispute and the Strait of Hormuz, resulting in the rapid dissipation of optimism from the earlier ceasefire. US President Trump ordered a maritime blockade of the Strait of Hormuz and warned that any Iranian vessels approaching the strait would be "immediately destroyed". The blockade was launched at 13 April, US Eastern Time (Monday), covering all vessels entering and leaving Iranian ports in the Arabian Gulf and Gulf of Oman. NATO and several Gulf states have expressed willingness to assist. In response, Iran's Islamic Revolutionary Guard Corps said the Strait of Hormuz is under its control and that any warships approaching the strait would be seen as violating the ceasefire agreement and would face a strong counterattack. Previously, two US destroyers attempted to enter the Persian Gulf but were locked on by Iranian forces and forced to retreat.
After the breakdown of negotiations and a cooling of US Federal Reserve rate cut expectations, crude oil prices rapidly rebounded and briefly surpassed $100/barrel. Currently, West Texas Intermediate (WTI) crude is quoted at about $99.97/barrel (UTC+8), up more than 6% from last week's low, with a daily gain of 3.52% and an intraday high of $105.63/barrel (UTC+8). The market is concerned about the prolonged risk of global energy supply disruption, directly exacerbating inflationary pressures. The latest US March inflation data showed that US CPI rose 3.3% year-on-year, significantly higher than February's 2.4%, the highest since June 2024. Among them, energy costs surged by 10.9% month-on-month, the largest single-month increase since September 2005, and gasoline prices rose 21.2%, contributing nearly three-quarters of the monthly CPI increase. High oil prices not only support the US dollar and Treasury yields but have also led investors to expect the Fed to keep rates high for longer, and could even tighten further should the conflict persist. According to CME "FedWatch" data, the probability that the Fed will keep rates unchanged in April is 98.4%, and the likelihood of a total rate cut of 25 basis points by year-end has risen to 35.2% (previously 21%). As a result, the holding cost of non-yielding gold has increased. Despite gold's nature as an inflation hedge, since the outbreak of the conflict, its ability to attract large-scale buying has clearly weakened as some institutions have made short-term sales to meet liquidity needs.
"This is a market highly driven by headlines. Everyone is focused on oil prices because they directly affect inflation, which in turn directly affects the Federal Reserve's policy," said Blue Line Futures Chief Market Strategist Phillip Streible.
SP Angel analysts noted: "We believe conflict-induced sell-offs are positive for gold's long-term outlook, as speculative positions are reduced."
Sprott Asset Management market strategist Paul Wong said in a report that uncertainty in future oil supplies may accelerate investment in photovoltaic solar power, driving robust structural demand for silver.
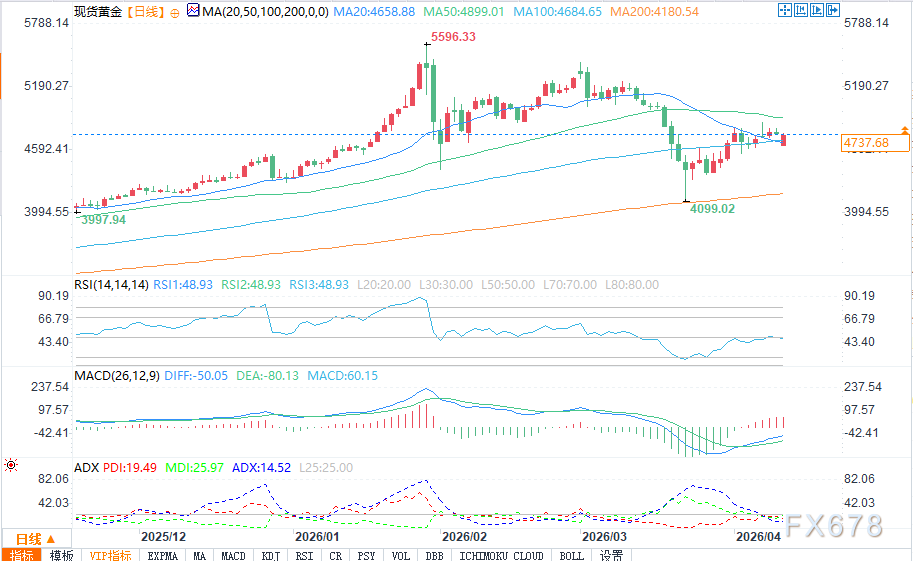
(Spot Gold Daily Chart Source: EasyHuitong)
From a technical perspective, the spot gold daily chart shows current prices above the 100-day moving average (about $4,684.64) and well above the 200-day moving average (about $4,180.54), but still below the 50-day moving average (about $4,899.01). The 50-day moving average, seen as key for the recent gold price trend, is acting as resistance, indicating a still-weak short-term market bias with an overall neutral to weak range-bound consolidation pattern.
Momentum indicators also lack clear direction: the 14-day RSI is around 48.92 (UTC+8), close to neutral, neither oversold nor overbought, indicating a tug-of-war between bulls and bears and a lack of buying confidence. For the MACD indicator, the DIFF line (about -50.07) remains above the DEA line (about -80.13), the histogram is positive but momentum is contracting. The current ADX value is about 14.52 (UTC+8), far below the threshold of 25, indicating there is no clear trend and the market is in a typical consolidation phase; +DI (19.49, UTC+8) versus -DI (25.97, UTC+8) shows bears with a slight upper hand.
Key signals to watch in the short term: If the price manages to stabilize above the 50-day moving average, the short-term bullish momentum will strengthen, with the next resistance near the previous highs in the $5,000–5,200 range (UTC+8); conversely, if the price loses the support of the 100-day moving average, the first support below will be in the $4,600–4,500 range (UTC+8), and if it falls further, watch for the strong support of the 200-day moving average (about $4,180).
Market Outlook: Geopolitical Risks and Fed Signals Coexist
This week, US economic data is relatively light. The focus is on the March Producer Price Index (PPI) to be released Tuesday (April 15)—according to China Merchants Macro data, March PPI year-on-year is +0.5%, with a month-on-month reading of 1.0% (UTC+8). The five major petrochemical industries are significant contributors and will intuitively reflect the pass-through effect of rising energy prices onto producer-side inflation. Also of note will be speeches by several Federal Reserve officials including Goolsbee and Harker, as well as the Federal Reserve Beige Book, all of which will provide further clues regarding rate trends. Although pressured in the short term by high rates and inflation fears, the long-term outlook for gold and silver remains optimistic amid escalating geopolitical turmoil, continued central bank gold buying, declining confidence in fiat currencies, and high sovereign debt. In particular, the People's Bank of China has increased its gold holdings for 17 consecutive months, with a net increase of 160,000 ounces in March 2026 (UTC+8), the largest single-month rise in nearly a year, reflecting a counter-cyclical strategic approach. The overall trend of global central bank gold purchases remains unchanged, with only some countries making tactical reductions due to fiscal or liquidity needs. Investors should pay close attention to developments in the Strait of Hormuz and the chain reaction of oil prices on the global economy.
Disclaimer: The content of this article solely reflects the author's opinion and does not represent the platform in any capacity. This article is not intended to serve as a reference for making investment decisions.
You may also like
ETH price faces short squeeze risk as big players buy
Fed’s Powell says credibility lost if President can fire officials
Cyble Malware Campaign Targets 180 Banking and Crypto Apps