
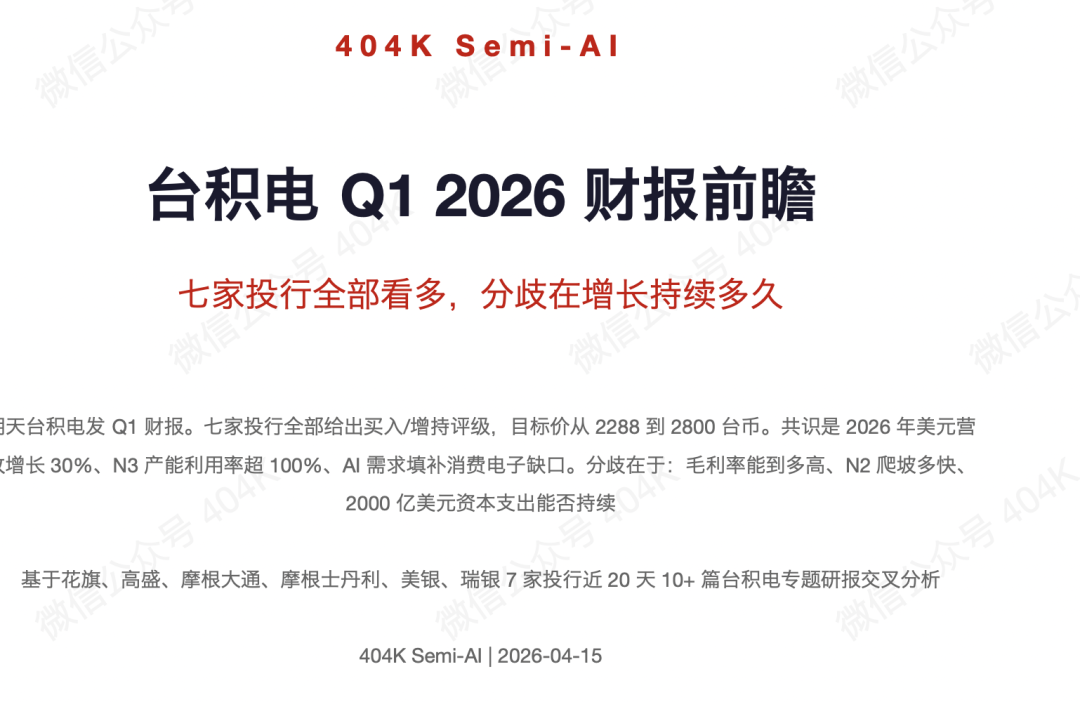
TSMC Q1 2026 Financial Report Preview — All Seven Investment Banks Are Bullish, Disagreement on How Long Growth Will Last

Tomorrow, TSMC will release its Q1 financial report. All seven investment banks have issued buy/overweight ratings, with target prices ranging from 2,288 to 2,800 NT dollars. The consensus is a 30% growth in USD revenue by 2026, N3 capacity utilization above 100%, and AI demand filling gaps in consumer electronics. Disagreements focus on: how high gross margins can reach, the speed of N2 ramp-up, and whether $200 billion in capital expenditures can be sustained.
Based on cross-analysis of 10+ TSMC thematic research reports from Citigroup, Goldman Sachs, JP Morgan, Morgan Stanley, Bank of America, UBS—but from the past 20 days.
404K Semi-AI | 2026-04-15
I. What to Watch Tomorrow — Three Key Highlights of the Q1 Financial Report
TSMC will release its Q1 2026 earnings after the market closes on April 16. Continuing the analytic framework set forth in the previous article, "TSMC 2330.TW — Deep-Dive Preview for Q1 2026 Financial Report" (April 8 edition), this piece is a comprehensive upgrade based on new research from Bank of America and Morgan Stanley over the past week. Compared to the previous edition which covered five investment banks, this expands coverage to seven, incorporating Bank of America's 4/14 Q1 preview, Morgan Stanley's 4/14 global AI/TPU industry update, and JP Morgan's 4/08 CoWoS packaging report.
Highlight One: Will management reiterate the full-year guidance? The company's previous guidance for 2026 calls for approx. 30% USD revenue growth and capex of $52–56 billion. None of the seven banks expect a downgrade in guidance. Bank of America, Goldman Sachs, and JP Morgan all expect management to reiterate these key figures. The critical question is whether there will be subtle changes in wording—such as shifting from "around 30%" to "at least 30%" or "low 30% range," which could directly impact expectations for the second half.
Highlight Two: Sequential growth for Q2 guidance. Q1 is highly likely to reach or exceed the upper guidance. Bank of America expects Q1 sales to grow 8% quarter-over-quarter, hitting the upper guidance; Goldman Sachs in its 3/30 report forecasts Q2 sales to grow 7% quarter-over-quarter, while Morgan Stanley expects 5–10%. If Q2 guidance is above +7% sequential, it implies more room for acceleration in the second half.
Highlight Three: Direction of gross margin. This is the variable with the largest divergence among the seven banks. JP Morgan estimates Q1 gross margin at around 67% (the highest), Morgan Stanley gives only 64–65% (the lowest), with a gap of over 2 percentage points. Goldman Sachs' 3/30 report forecasts Q2 gross margin at 64.8%, Bank of America expects Q2 gross margin to rise from 63–65% to about 66%. The direction—whether margins keep rising or oscillate at a high level—will decide whether full-year EPS is 94 NT dollars (approx. $2.9) or 98 NT dollars (approx. $3.1).
II. The Seven Banks' Consensus — All Bullish, AI Filling Consumer Gaps, Tight Capacity
The seven banks are highly consistent in three key judgments. The strength of this sell-side consensus is extremely rare in the history of TSMC coverage.
Consensus One: 30% USD Revenue Growth for 2026 Is Almost Certain
Goldman Sachs and JP Morgan respectively forecast 2026–2027 USD revenue growth of 35%/30% and 35%/30%, with perfectly matched numbers. Bank of America expects 30% year-on-year growth in 2026 (USD), and 16% sequential growth in the second half. Morgan Stanley maintains an approx. 30% full-year growth expectation. No institution questions this growth rate.
The core driver behind this growth has expanded from "AI accelerator as single category" to "the whole advanced process demand portfolio". JP Morgan's 4/03 report clearly states: Beyond AI accelerators, network interface chips and server CPUs are increasing tightness in advanced processes. This means that even if demand for one type of AI chip fluctuates, others can fill the gap.
Consensus Two: N3 Capacity Utilization Exceeds 100%, Tightness Continues to 2027
JP Morgan's report is most direct: N3 capacity utilization exceeds 110%, and N3 revenue will triple in 2026. Goldman Sachs' 4/08 report concludes that tightness in advanced process capacity lasts at least until 2027 and beyond. This matches UBS data cited previously—UBS projects total N3 demand for the year at 1.701 million wafers vs. capacity of 1.71 million wafers, utilization at 99%.
Goldman Sachs' 3/30 report reveals a structural shift overlooked by the market: Cloud-based AI chips are moving from N4 to N3, and by year-end, AI will account for about 60% of N3 demand. This means N3 lines are rapidly filled by AI orders, squeezing out space for smartphones and consumer electronics. Goldman Sachs also notes, however, that cuts in smartphone and consumer electronics orders are compensated by AI—TSMC's capacity utilization has not dropped due to sluggish consumer demand, but instead has risen due to AI overflow demand.
Consensus Three: AI Semiconductors Are Entering a Multi-Year Super Cycle
Morgan Stanley offers the broadest time-span view: AI semiconductor compound annual growth rate from 2024–2029 is 55–59%. NVIDIA's GTC conference confirmed the 2027 AI addressable market exceeds $1 trillion. Citi's data is equally aggressive: AI-related revenue next year is projected to more than double year-on-year.
Morgan Stanley's 4/14 industry update introduces two new concepts to describe this cycle. First is "technology inflation"—AI drives comprehensive cost increases for wafers, packaging/testing, and memory. Second is "AI dominance"—AI chips are prioritized for capacity, crowding out non-AI chip supply. For TSMC, these trends mean: strengthening pricing power, and capacity allocation increasingly tilted toward high-value AI clients.
III. Divergence One: How High Can Gross Margin Go
This is the most disputed segment among the seven banks and a core variable directly affecting valuation.
JP Morgan is most optimistic: Q1 gross margin expected to be about 67%. The 4/03 JP Morgan report's margin forecast is noticeably higher than other banks. Its logic: N3 capacity utilization above 110% improves the mix—higher advanced process share plus full utilization translates to stronger depreciation dilution effects, lowering unit costs. Additionally, 6–10% price increases for advanced nodes are fully reflected in Q1 revenue.
Bank of America is relatively optimistic: Q2 gross margin expected to be about 66%. Bank of America's 4/14 report notes, 3nm utilization above 100%, and customers willing to pay premiums for faster turnaround. This "rush order premium" is a key variable in their bullish margin outlook—when clients pay extra for early chips, TSMC's bargaining power exceeds simple price hikes.
Goldman Sachs is moderate: Q2 gross margin 64.8%. Goldman Sachs' 3/30 Q1 preview is cautious for Q2 margins. Their conservativeness comes from a specific cost item: helium. For every 10% increase, margins fall 0.2–0.3 pts. Considering Middle Eastern tension affects helium supply, Goldman factors in a safety margin in its prediction.
Morgan Stanley is the most conservative: Q2 gross margin 64–65%. Morgan Stanley's 4/07 report gives the lowest range among the seven. Its stance is not skepticism about TSMC fundamentals, but prudence regarding overseas expansion costs—TSMC is building wafer fabs in the US, Japan, and Germany, where manufacturing costs are significantly higher than in Taiwan. This will erode margins long term.
Investment implications of divergence. Taking 2027 as reference, if gross margins reach 66–67% (JP Morgan/Bank of America), EPS would be approx. 126–131 NT dollars ($3.9–$4.1); if they stay at 64–65% (Morgan Stanley), it's approx. 113–117 NT dollars ($3.5–$3.6). That 15% EPS difference directly impacts target prices.
IV. Divergence Two: N2 Ramp Speed and Incremental Growth for 2027
N2 is TSMC's next-generation process node. Its mass production timing and ramp speed will decide whether 2027–2028 growth accelerates or slows.
Citigroup is most aggressive: N2 will become TSMC’s largest process node in history. Citi's 3/27 report gives the boldest N2 forecast. Citi expects N3/N2 revenue in 2027 up 30–40% and 100+%. Its 2027/2028 EPS forecasts are 130.72 and 165.99 NT dollars ($4.1 & $5.2), 18% & 28% above consensus, meaning Citi sees N2 as a major revenue explosion starting 2027.
Goldman Sachs’ 3/30 report provides more details: N2 ramping up faster than N3. This judgment is based on two points: one, N2’s increased process complexity is less dramatic than N3 vs N5, so yields ramp up faster; two, AI clients are already locking in N2 capacity ahead of time, with greater order visibility than N3 at similar stages.
Morgan Stanley is relatively conservative. Morgan Stanley’s 4/07 report doesn’t provide specific N2 revenue forecasts, but its 2027 EPS (116.94 NT dollars, about $3.6) is 10% below Citi’s, implying a more cautious assumption on N2 ramp speed. Risks include: initial N2 line yields possibly not meeting targets, and competition from Terafab dispersing client orders.
JP Morgan’s 4/08 CoWoS report indirectly confirms this. JP Morgan raised its forecasts for CoWoS and SoIC capacity; SoIC capacity is rising from 8,000–10,000 wafers/mo to 60,000–70,000 by 2028. Advanced packaging is key to AI performance and the core mate for N2 chips. The speed of packaging capacity expansion indirectly validates TSMC's confidence in N2 demand.
UBS’ 4/09 report provides another perspective from NVIDIA’s roadmap. NVIDIA Rubin Ultra keeps dual-chip CoWoS architecture, while 2028’s Feynman may turn to four-chip plus chiplet. CoPoS panel-level packaging targets mass production in 2028. This means advanced packaging demand complexity will climb for two more years, deepening reliance on TSMC’s technology platform.
V. Divergence Three: The Meaning of $200 Billion Capital Expenditure
TSMC’s cumulative capex for 2026–2028 is forecasted at $190–200 billion USD, an unprecedented figure.
Goldman Sachs 4/08 gives $200 billion. Goldman expects capex to total $200 billion over 2026–2028. Referencing Deutsche Bank data cited previously, TSMC’s past three years (2023–2025) capex totaled around $101 billion—the next three years nearly double this.
Bank of America provides the most detailed annual breakdown: $50B (mid) in 2026, $63B in 2027, $77B in 2028. Three-year total: $190 billion. Notably, Bank of America's sequential acceleration structure—2027 up 26%, 2028 up 22% over respective prior years. This means capex isn’t a one-off spike, but a continuous ramp-up.
Citi provides 2027–2028 figures: $67B and $75B. Compared to Bank of America's $63B and $77B, Citi is more aggressive for 2027 and slightly conservative for 2028. The difference is within 5%; direction is consistent.
JP Morgan forecasts $190 billion for 2026–2028. Matching Bank of America's cumulative sum.
What does this mean? First, TSMC management’s confidence in long-term AI demand is extremely firm—no company would commit $200 billion over three years in uncertain times. Second, this capex directly flows to upstream equipment chain. Refer to UBS semiconductor capex chain analysis: NVIDIA demand → TSMC ramp-up → ASML/Applied Materials/LAM equipment orders. TSMC's $200 billion over three years means the global wafer fab equipment market is truly entering a 3–4 year super cycle.
Third and most closely-watched: Is this massive capex justified by reasonable returns? Using 2028 as reference, if USD revenue grows at a 30%/30%/29% CAGR (Goldman Sachs forecast), TSMC will exceed $150 billion in revenue by 2028. With $77B in capex, capex/revenue ratio is approx. 51%—slightly above historical median but still manageable. If advanced process price hikes persist and utilization stays high, free cash flow won’t be heavily eroded.
VI. Target Price Comparison and Valuation Methods
Target Price Summary
| Citi | 2800 | Approx. $88 | Buy | 3/27 | +51% |
| Goldman Sachs | 2750 | $550 | Buy (CL) | 4/08 | +48% |
| Bank of America | 2530 | $500 | Buy | 4/14 | +36% |
| UBS | 2500 | Approx. $78 | Buy | 4/09 | +34% |
| Goldman Sachs (Q1 Preview) | 2500 | Approx. $78 | Buy | 3/30 | +34% |
| JP Morgan | 2400 | Approx. $75 | Overweight | 4/03 | +29% |
| Morgan Stanley | 2288 | Approx. $72 | Overweight | 4/07 | +23% |
Upside potential calculated based on closing price of 1,860 NTD ($58) on 4/7
Valuation Method Comparison
Almost all seven banks use forward PE as their main valuation anchor.
JP Morgan gives the clearest methodology: 20x 12-month forward PE. Based on 2026/2027 EPS of 95.50/113.28 NTD ($3.0/$3.5), blending for 12 months and applying 20x, obtaining target price of 2,400 NTD (approx. $75).
Goldman Sachs’ 3/30 report uses 21x 2027 PE: Based on 2027 EPS of about 125 NTD ($3.9), applying 21x, target price of 2,500 NTD (approx. $78). After the 4/08 update, raised to 2,750 NTD (approx. $86), implying a slightly higher multiple.
Bank of America provides a historical valuation reference: Currently 15x 2027 PE, historical range of 11–21x. Bank of America uses 20x 2027 PE, target price 2,530 NTD (approx. $79). This means a 33% valuation recovery from 15x to 20x—under the AI super cycle, Bank of America views a return to the top historical range as justified.
EPS Forecast Comparison
| Citi | — | 130.72 (approx. $4.1) | 165.99 (approx. $5.2) |
| Bank of America | 97.64 (approx. $3.1) | 126.91 (approx. $4.0) | — |
| Goldman Sachs | 95.24 (approx. $3.0) | 125.00 (approx. $3.9) | — |
| JP Morgan | 95.50 (approx. $3.0) | 113.28 (approx. $3.5) | — |
| Morgan Stanley | 94.30 (approx. $2.9) | 116.94 (approx. $3.6) | 139.66 (approx. $4.4) |
Citi's 2027 EPS of 130.72 NTD (approx. $4.1) is the highest, 12% above Morgan Stanley's 116.94 NTD (approx. $3.6). This gap mainly comes from previously discussed differences on gross margin and N2 ramp speed.
VII. Cross-Verification with ASML Earnings
Refer to "ASML Q1 2026 Financial Report Review" (April 15) for the full analysis. ASML has released its Q1 results as of April 15, and three data points directly validate TSMC's tight capacity narrative.
First, Memory customers’ 2026 capacity is fully sold out. ASML CEO Christophe Fouquet stated in an interview that "supply will not match demand for the foreseeable future". Memory segment sales jumped from 30% in Q4 to 51% in Q1, surpassing Logic for the first time. Korean customers (Samsung, SK Hynix) purchased approx. €2.8 billion ($3 billion) in a single quarter, up more than 70%. Memory makers are aggressively expanding—these capacities will ultimately require TSMC's advanced packaging and logic process support.
Second, full-year guidance raised and narrowed to €36–40 billion ($38.9–43.2 billion). From the wide range of "4–19% growth" at the start of the year, now narrowed near the upper end, implying downstream demand is stronger than ASML management expected. TSMC is ASML’s largest logic process client—if ASML is confident in the full year, it suggests TSMC's equipment procurement is proceeding smoothly.
Third, DUV demand upgraded from "flat" to "growth". This directly confirms that TSMC isn't relaxing in mature nodes either. Wafer fab expansion needs not just EUV tools for key layers, but massive DUV usage for many process stages. Each new N2 or N3 fab TSMC builds requires both EUV and DUV equipment in tandem.
These three points form a perfect supply chain cross-verification: ASML is selling equipment as fast as possible → memory makers are sold out for the year → TSMC’s advanced process demand is only tighter. If TSMC reiterates 30% growth and $52–56 billion capex at tomorrow's investor meeting, ASML's results have already provided a confidence boost in advance.
VIII. Risks and Key Calendar Dates
Five Major Risks
Risk One: Geopolitics. Morgan Stanley's 4/07 report flags geopolitics as the top concern. TSMC’s capacity is still highly concentrated in Taiwan, overseas plants are being launched but add little incremental capacity for 2026–2027. Any escalation around Taiwan would directly impact valuation.
Risk Two: Overseas expansion costs. TSMC is building fabs in Arizona (USA), Kumamoto (Japan), and Dresden (Germany). Manufacturing costs overseas are much higher than in Taiwan, potentially eroding gross margins in the long run. Morgan Stanley's 4/07 report especially mentions the potential impact of Terafab competition.
Risk Three: Scrutiny cycle of AI investment returns. As discussed in "Semiconductor Q1 2026 Financial Preview"—the market is discounting "AI investment sustainability" (e.g., NVIDIA trades at 16x PE as evidence). If hyperscale cloud providers show signs of hesitation in capex guides for Q2/Q3, TSMC's valuation will also be pressured.
Risk Four: Rising costs for helium and other commodities. Goldman Sachs estimates every 10% rise in helium costs reduces TSMC's gross margin 0.2–0.3 pts. Under the uncertain Middle East situation, this is a tangible but easily overlooked cost factor.
Risk Five: Uncertainty of China AI GPU foundry opportunities. Morgan Stanley lists "China AI GPU foundry opportunities" as an area of interest. Under export controls, TSMC's ability, and to what extent, to manufacture for Chinese AI chip clients remains a policy-sensitive grey area.
Key Calendar Dates
| April 15 | ASML Q1 earnings | Equipment cross-verification (released, positive) |
| April 16 | TSMC Q1 Earnings Call | Most important event of the season |
| April 22 | Texas Instruments Q1 earnings | Broad benchmark for semiconductors |
| Late April | AMD Q1 earnings | Data center CPU share, AI inference demand |
| Late May | NVIDIA Q1 earnings | Data center revenue, Blackwell delivery timetable |
Key Differences Compared to Last Edition
Relative to the April 8 edition covering five investment banks, this piece adds the latest reports from Bank of America and Morgan Stanley, expanding overall coverage from five to seven banks. The core judgment continues the previous "fully bullish but differences at the ceiling" framework, yet with three updates: (1) Bank of America's annual capex breakdown ($50B/$63B/$77B) offers essential evidence for sequential acceleration; (2) ASML Q1 report is released—supply chain cross-verification upgraded from prediction to evidence; (3) Morgan Stanley's "technology inflation" and "AI dominance" concepts give new frameworks for analyzing TSMC's pricing power.

Disclaimer: The content of this article solely reflects the author's opinion and does not represent the platform in any capacity. This article is not intended to serve as a reference for making investment decisions.
You may also like
Lagarde speech: ECB set to upgrade its inflation forecast in June
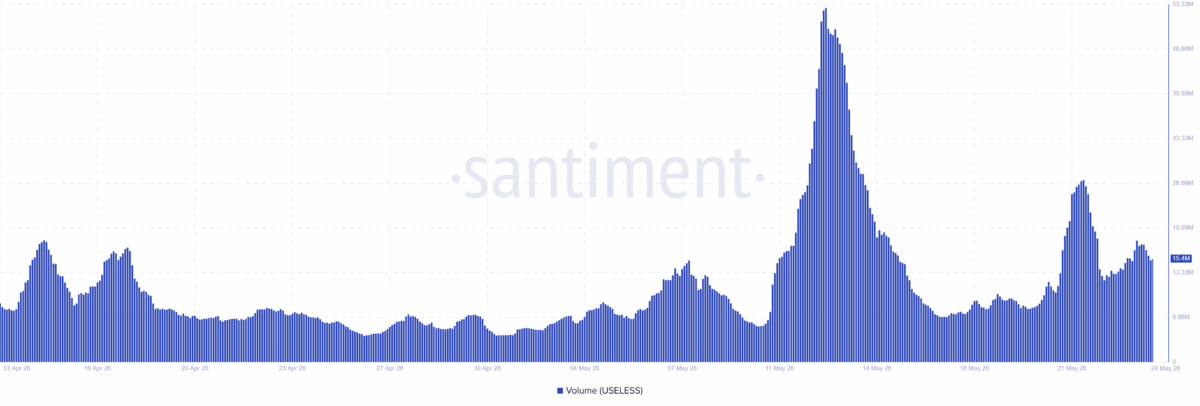
Useless Coin extends rally – Can strong demand push price above $0.086?
Trending news
MoreIN coin fluctuated 54.5% within 24 hours: price surged rapidly from a low of $0.07189 to a high of $0.1111 before dropping back to $0.07694, with no clear public catalyst observed.
Weight loss effect comparable to surgery! Eli Lilly RETA becomes the strongest "weight loss miracle drug" in history—"Will obesity become a rare disease in a few years?"
Crypto prices
More





