
Key Insights
- BNB climbed nearly 10% from April lows after breaking above a descending triangle pattern that restricted gains since February during recent sessions.
- CoinGlass data showed rising open interest and positive funding rates, reflecting stronger bullish positioning among leveraged BNB derivatives traders throughout this week.
- BNB reclaimed its 50-day moving average while improving MACD and RSI indicators supported continued upside momentum across markets over recent sessions.
BNB Breakout Gains Strength
BNB climbed above a multi-month descending triangle pattern after reclaiming resistance near $630, signaling improving momentum across the market. The token traded around $638 on May 8 and extended its rebound from April lows near $582. Additionally, buyers pushed price above a descending trendline that had limited upside attempts since February.
BNB remained under pressure earlier this year after Binance faced renewed regulatory scrutiny tied to sanctions compliance concerns. Reports linked Iran-connected entities to more than $1 billion in crypto flows through the exchange, prompting stronger oversight demands from United States authorities. Consequently, the token dropped more than 30% from previous highs above $900 during the broader market decline.
Market Sentiment Improves
Sentiment gradually stabilized after Binance expanded compliance measures across several jurisdictions and improved cooperation with regulators. Besides, stronger conditions across the wider crypto market helped restore investor confidence as Bitcoin continued holding major support levels. Large-cap altcoins also attracted renewed inflows as traders rotated back into assets showing active network growth and stronger liquidity.
CoinGlass data showed elevated BNB open interest between roughly $920 million and $970 million during the past trading session. Moreover, the weighted funding rate stayed slightly positive, reflecting growing bullish positioning among derivatives traders willing to maintain leveraged long exposure. Rising participation across futures markets also suggested that traders expect momentum to continue building in the short term.
Technical Indicators Turn Positive
The daily chart confirmed a breakout above the descending resistance trendline that shaped the bearish triangle structure for several months. However, buyers repeatedly defended support near $580 during earlier pullbacks, helping stabilize the price before the latest breakout developed. BNB also reclaimed its 50-day simple moving average, which previously acted as dynamic resistance during recent recovery attempts.
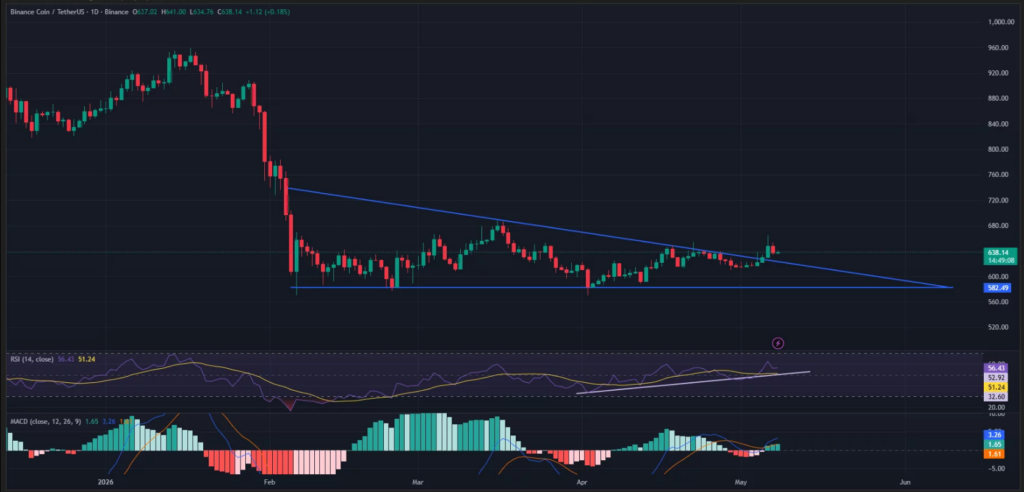
Technical indicators continued to improve as the MACD completed a bullish crossover, while the histogram printed green bars. Additionally, the RSI climbed above 56 and maintained a higher-low structure, signaling stronger buying pressure on the daily timeframe. Traders now monitor whether BNB can maintain support above the former resistance line during the coming sessions.
Upside Targets Remain In Focus
If buyers sustain momentum above the breakout zone, BNB could target resistance near $680 before attempting a move toward the psychological $720 region. However, failure to hold above the broken trendline may return the token toward the important $600 to $580 support range. Market participants continue watching whether bulls can extend the recovery toward levels seen earlier this year.