Sui (SUI) continues strong bullish momentum despite a recent pullback from its local high near $1.46. It currently trades at $1.26, posting an 11.78% daily gain and a 33.71% weekly increase. Trading volume stands at $2.87 billion, showing strong market participation and renewed interest. Additionally, market capitalization reaches $5.03 billion, highlighting expanding investor confidence.
SUI recently faced rejection near the 0.786 Fibonacci level after touching highs around $1.46. However, buyers quickly defended the pullback, preventing a deeper correction from developing. The current structure still favors bulls because the 20, 50, 100, and 200 EMAs remain fully aligned upward.
Additionally, price continues holding above the important $1.18 to $1.20 support region. Analysts consider this area critical for maintaining bullish continuation during the current consolidation phase. If buyers maintain control above this zone, SUI could revisit resistance near $1.37 before attempting another breakout toward $1.50.
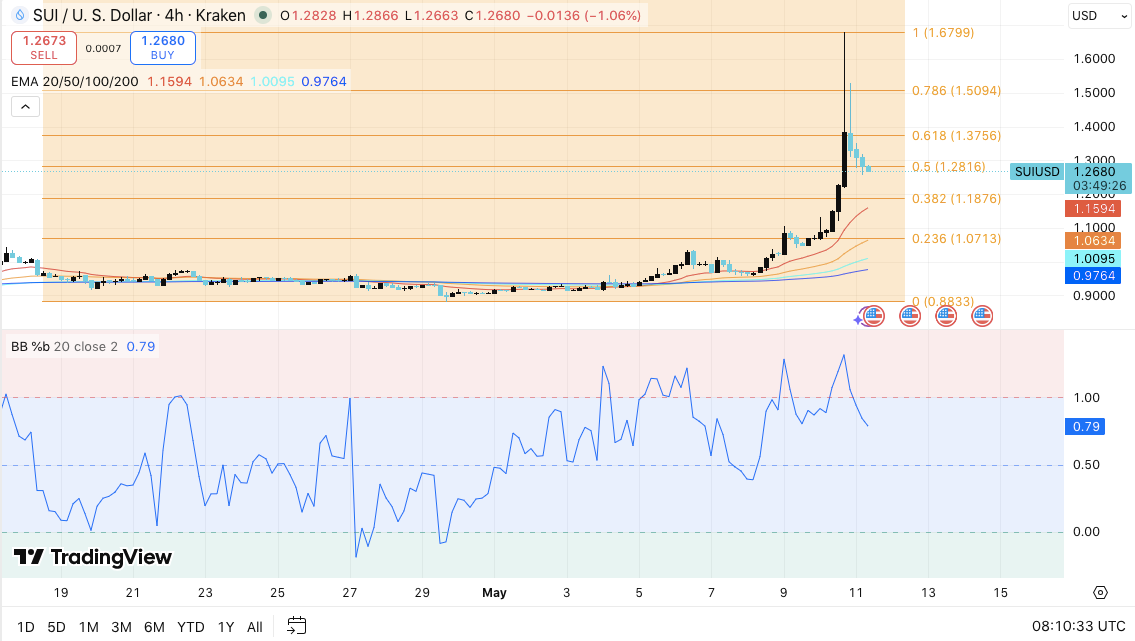
Moreover, the Bollinger Band %B indicator suggests overheated momentum has started cooling gradually. The latest reading near 0.79 signals reduced buying intensity after the recent vertical move. Nevertheless, bulls still maintain overall market control while price remains above the 100 EMA region near $1.00.
On the downside, traders closely watch $1.07 as the next major breakdown support. A failure below that level could expose the broader macro support region near $0.88.
Sui’s derivatives market also reflects changing trader sentiment over recent months. Open interest surged aggressively between May and September 2025 as speculative activity intensified across the market. During that period, open interest climbed beyond $2.5 billion while SUI approached local highs.
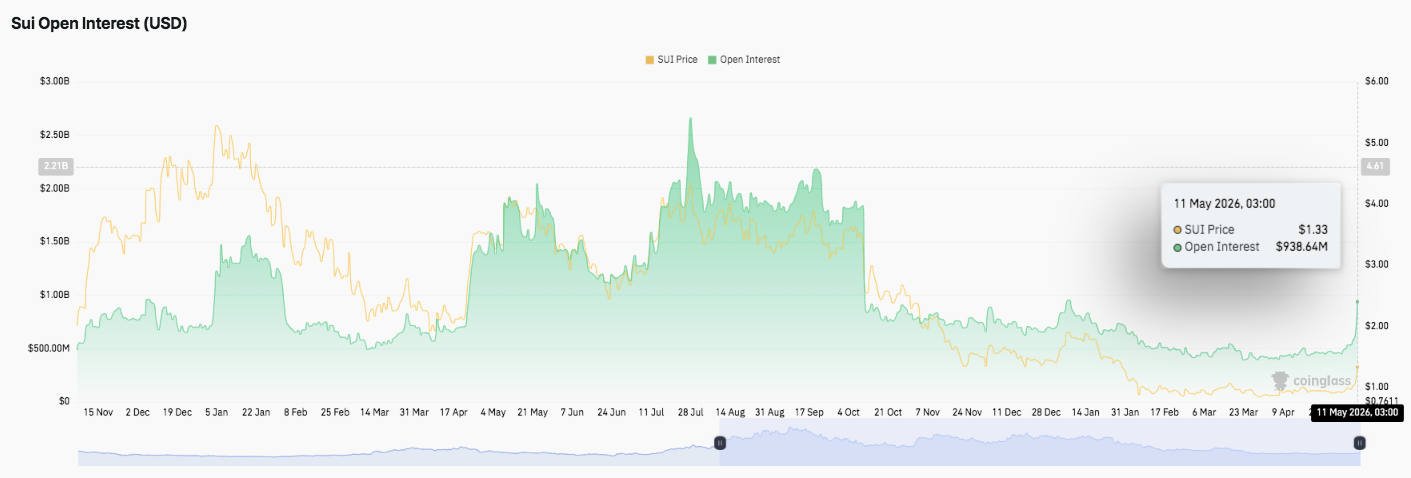
However, market conditions weakened significantly after October. Both price and open interest declined steadily as liquidations and profit-taking accelerated. Consequently, leveraged participation dropped sharply throughout late 2025 and early 2026.
Recently, open interest rebounded toward $938 million, suggesting speculative activity may be returning gradually. This increase often signals rising volatility expectations as traders prepare for larger price movements.
Spot inflow and outflow data still shows broader selling pressure dominated much of the previous cycle. Large exchange outflows repeatedly appeared as investors locked profits during SUI’s decline from above $4.00.
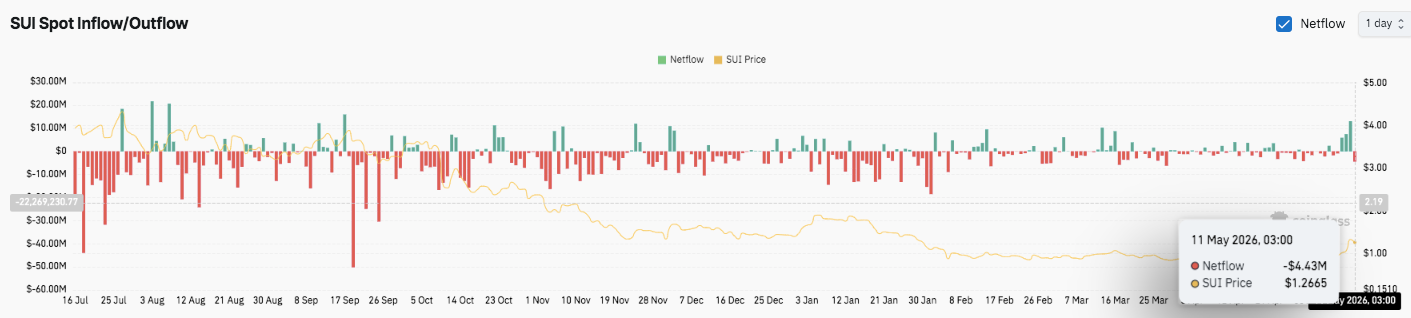
However, recent sessions reveal a more balanced flow structure. Inflows and outflows now alternate more evenly, indicating weakening sell-side pressure. Although the latest session recorded a moderate negative netflow near $4.43 million, the data suggests bearish momentum continues slowing gradually.
Key levels remain clearly defined as Sui trades within a post-breakout consolidation phase, suggesting a pause before the next directional move. The structure still favors bulls, but short-term compression is evident after recent volatility.
Upside levels: $1.2816, $1.3756, and $1.5094 act as immediate resistance zones. A breakout above this cluster could extend momentum toward $1.68 and $1.85 if buying pressure accelerates.
Downside levels: $1.1876 serves as the first key support, followed by $1.0713 and $0.8833 as deeper safety zones. A breakdown below $1.18 would signal weakening momentum and open room for a larger retracement phase.
Resistance ceiling: The $1.46–$1.50 region remains the major upside barrier, aligning with recent rejection highs. A clean reclaim above this zone would confirm renewed medium-term bullish strength.
The technical structure suggests SUI is consolidating inside a rising channel after a strong impulse rally. Consequently, the market is forming a compression zone where volatility expansion becomes increasingly likely.
Sui price direction depends on whether buyers can defend the $1.18–$1.20 support zone during cooling momentum. This area now acts as a critical trend validation level.
Additionally, sustained trading above all major EMAs still supports a bullish bias. However, rejection from higher Fibonacci levels shows profit-taking pressure is building.
If inflows strengthen and momentum returns, SUI could retest $1.37 and $1.50 in the next bullish wave. Moreover, a confirmed breakout above $1.50 may unlock continuation toward new cycle highs.
However, failure to hold $1.18 could shift sentiment quickly. Consequently, price may revisit $1.07 before buyers attempt stabilization again.
For now, SUI remains in a decisive technical zone. The next move will depend on whether accumulation continues or distribution resumes.