Solana trades at $95.26 on May 13, breaking above the 0.382 Fibonacci level that held as resistance for three months as spot ETF inflows accelerate and the daily MACD prints its first bullish cross since January.
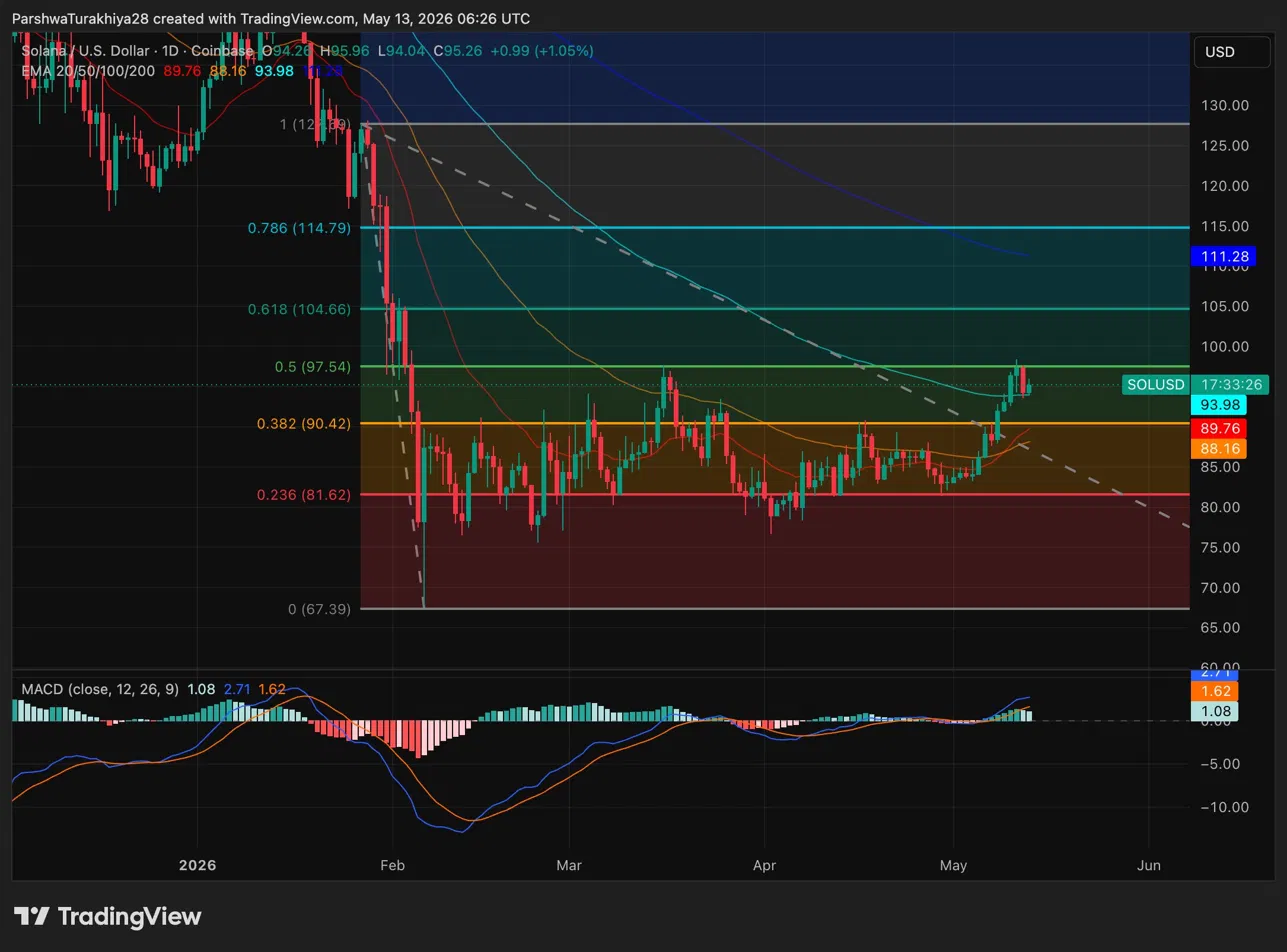 Solana Daily Price Action (Source: TradingView)
SOL spent February through April trapped between the 0.236 Fib at $81.62 and the 0.382 at $90.42, unable to close above either with any conviction. Price broke the 0.382 level in early May and is now pressing the 0.5 Fib at $97.54, the next resistance before the 0.618 at $104.66.
The MACD backs the move. MACD line at 1.08 crossed above the signal at 2.71 with the histogram at 1.62 and expanding, the first clean daily bullish cross since January. The 20 EMA at $89.76 and 50 EMA at $88.16 are both below price and acting as support. The 100 EMA at $93.98 is the immediate dynamic resistance sitting right at current price, the level SOL needs to close above to confirm continuation.
SOL Key levels For May 14:
- Resistance: $97.54 (0.5 Fib), $104.66 (0.618 Fib), $114.79 (0.786 Fib)
- Support: $90.42 (0.382 Fib), $88.16 (50 EMA), $81.62 (0.236 Fib)
- MACD: Bullish cross confirmed, histogram expanding
SOL spot ETFs recorded $19.07M in daily inflows on May 12, following $26.57M the prior session. Cumulative inflows crossed $1.10B with total net assets now at $1.06B. Bitwise’s BSOL led on May 12 with $15.98M, bringing its cumulative total to $899.18M. Fidelity’s FSOL added $3.09M on the day.
Related: Injective Price Prediction: INJ Surges 33% as Bulls Eye $6
Five of the last six sessions recorded positive inflows. That kind of consistent institutional buying into a price breakout reads differently than the isolated spikes seen through most of Q1. One outflow day in six is not a warning sign, it is rotation behavior.
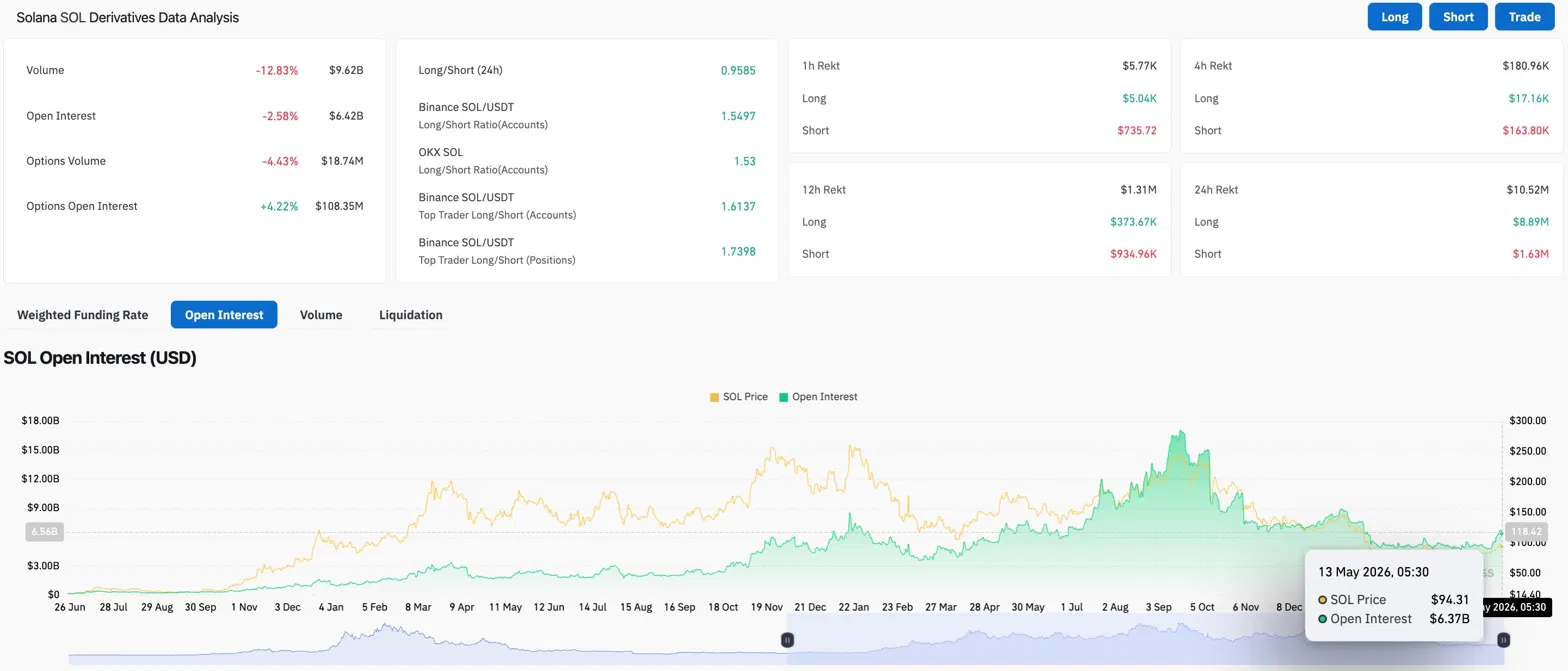 SOL Derivatives Data (Source: Coinglass)
Volume dropped 12.83% to $9.62B while open interest fell 2.58% to $6.42B. Both declining together after a strong breakout week is normal consolidation, not distribution. Options open interest rose 4.22% to $108.35M, with traders using options rather than spot leverage to position for the next leg.
Retail on Binance sits long at 1.5497. Top traders are running 1.7398 by positions. Over 24 hours, $8.89M in longs were liquidated against $1.63M in shorts. Shorts absorbed five times less pain than longs, but neither reading is extreme enough to call an imminent squeeze.
SOL spot netflow came in at positive $8.02M on May 13, meaning supply is moving onto exchanges near resistance.
One positive netflow day against a backdrop of persistently negative readings over several months does not reverse the macro supply trend, but it is worth watching if it continues as price presses $97.54.
- Upside: Daily close above the 100 EMA at $93.98 and 0.5 Fib at $97.54 targets $104.66. Continued ETF inflows and CLARITY Act passage this week would accelerate the move. Extended target $111.28 where the 200 EMA sits.
- Downside: Rejection at $97.54 with the 100 EMA at $93.98 failing sends SOL back to the 0.382 Fib at $90.42. Losing that level on a daily close puts $88.16 back in play.