
Federal Reserve Leadership Change: Is Market Turbulence Unavoidable? Should You Run or Stay?


Chapter One: Warnings After the Celebration — Locking in Gains
On April 6th, we took a heavy contrarian position in the semiconductor sector in the VIP group, accurately capturing the bottom. The fruits of victory now are more than substantial. However, this is by no means the time for greed.
Although the SPY has risen for six consecutive weeks and the surface seems prosperous, the foundation is actually shaky. The market is on the edge—a full 69% of the gains is supported by just 10 stocks, with the remaining 490 performing only modestly. This extreme crowding has even surpassed the 2000 bubble, making the structure extremely fragile.
When everyone crowds on the same boat and leverage is maxed out, even the slightest wave becomes a disaster. Since we already “entered from the left side” successfully on April 6th, now is the key time to “lock in profits from the right side” and hand part of our chips over to the enthusiasts.
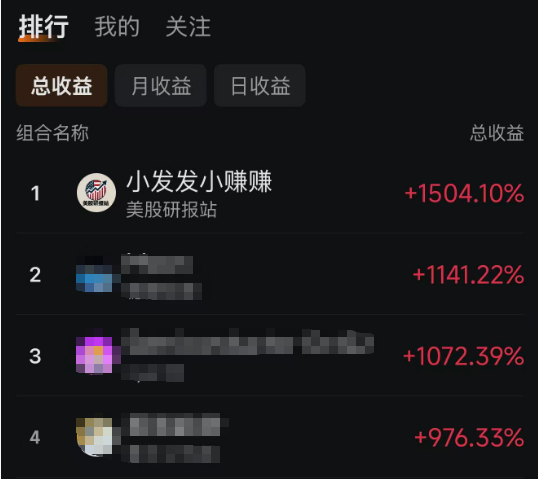
Chart below: Over the past four years,our total returns climbed to number one on the whole Futu NiuNiu platform among 30 million users, growing 15 times over! That’s 24 times the return of the S&P 500.

Chapter Two: Oil Prices as the Sword of Damocles
Just yesterday, U.S. President Trump rejected Iran’s ceasefire proposal, and this geopolitical powder keg instantly ignited the crude oil market, causing oil prices to soar above $100 per barrel—and even hit $105. You might think rising oil prices are unrelated to you, but in fact, this is a massive liquidity trap—the higher the oil price, the less cash the world has to repay dollar debts, forcing the dollar to strengthen and triggering a global liquidity crisis. Even worse, high oil prices directly put stagflation (economic stagnation + inflation) risk on the table, a fact already reflected by the bond market. Since the end of March, bonds have completely decoupled from the stock market rally as traders know well that if oil remains above $90 for an extended period, future inflation data will look ugly. Also, don’t forget, a closure of the Strait of Hormuz not only pushes energy prices up but also blocks one-third of global fertilizer trade, directly threatening spring planting in the northern hemisphere. This means global food prices will likely see another surge in the coming months.
Chapter Three: The Ghost of Inflation & Fed Leadership Change
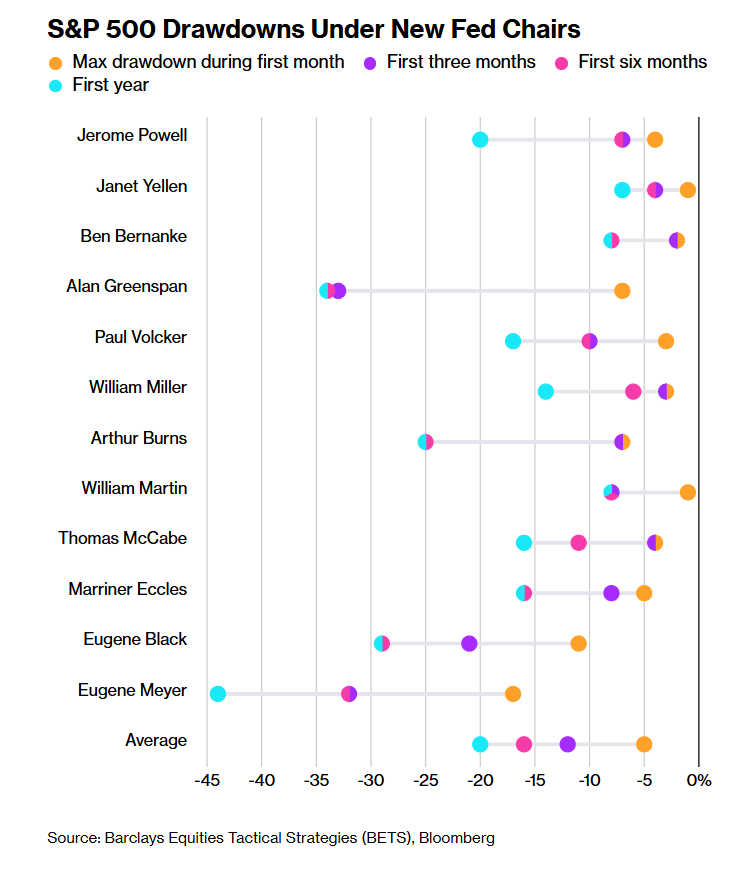
This week is macro data super week, with April’s CPI, PPI, and retail sales data successively announced—and the results are not encouraging. CPI is up 3.8% year-on-year, higher than the expected 3.7%, and core CPI remains far above the Fed’s 2% target. This isn’t just a numbers game; it means the cost of living keeps rising, and consumer confidence has dropped to 48.2—the lowest since records began in 1978, even worse than the 1970s stagflation period. Meanwhile, the Fed is facing a leadership change, with Kevin Walsh expected to take office this weekend. History doesn’t lie: Barclays research shows that in the first year after a new Fed chair takes over, the market typically experiences sharp volatility. Looking back to Powell’s first year in 2018, the market almost dropped 20%. On one side is stubborn inflation; on the other, a highly uncertain central bank leader. For a stock market at historic highs, this is never a good combination.
Chart below: S&P 500 drawdown statistics under new Fed chairs
Chapter Four: The Overdrawn AI Myth
It’s undeniable that AI is the core driving force of this bull market. From AMD to Micron, and now to Intel, any stock brushing against AI sees its price skyrocket—even traditional memory chip companies are experiencing shortages and price hikes thanks to AI demand. But this frenzy is showing signs of exhaustion; the Semiconductor Index is hitting new highs, yet trading volumes are shrinking, suggesting the fuel for higher prices is running out. More concerning, this prosperity hasn’t benefitted the real economy—first quarter GDP grew just 2%, with 70% of that solely from AI-related spending, while the rest of the economy is stagnant or even declining. The employment data is also misleading: while headline employment rises, almost all new jobs are in healthcare and social assistance, with more than 100,000 jobs lost in all other sectors over a year. As tech giants (such as Oracle, Meta, HSBC, etc.) lay off workers en masse because of AI, we must realize that AI brings not just efficiency, but also white-collar job displacement and growing economic imbalance.
Chart below: The S&P 500’s rally is led by a concentrated group of AI stocks
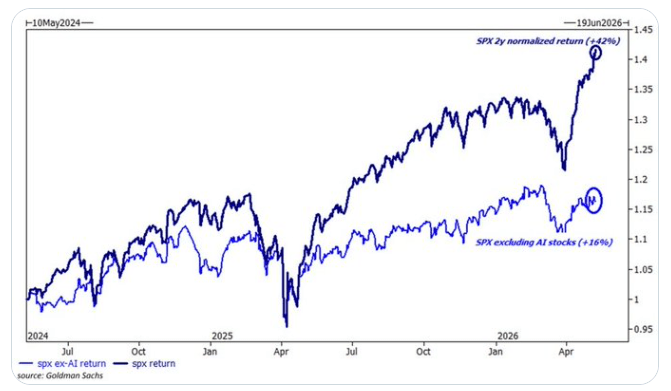
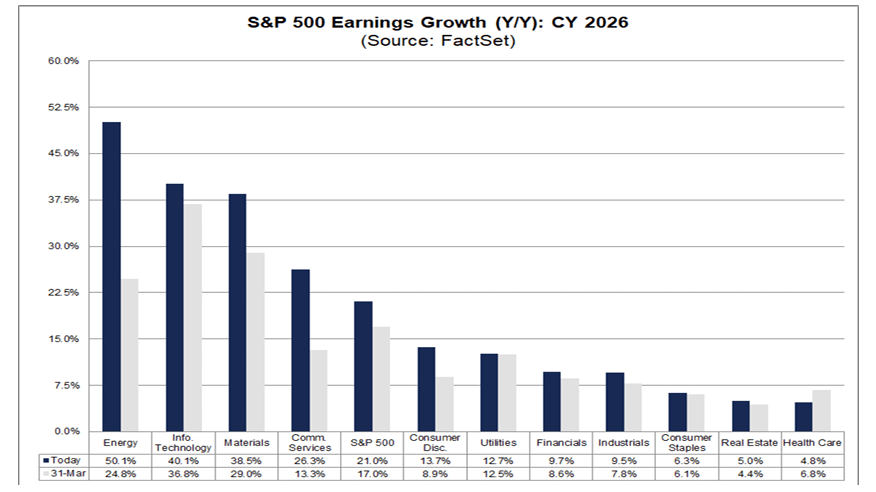
Chart below: The S&P 500’s rebound is concentrated in just a few sectors
Chapter Five: Extreme Valuations and Warnings from History
Let’s look at the cold, hard numbers: the Shiller P/E ratio now stands at 42.05—a figure that surpasses the bubble territory at the end of 2021 and is approaching the peak of the 1999 dot-com bubble. Back then, GDP growth was a real 4%+, but today, US debt levels are several times larger. Current US federal debt approaches $40 trillion, a record high as a share of GDP since WWII, yet the stock market still parties on—it's truly absurd. The 30-year treasury yield has soared to 4.98%. Even after the Fed cut rates by 175 basis points, long-term rates continue to rise, which shows market fear over long-term inflation and fiscal deficits already outweighs short-term monetary easing. Market concentration has hit a staggering 57%—meaning more than half the market cap is centered in technology and related sectors. This “top-heavy” structure has ended in a crash every time in history, be it in 2000 or 2008, without exception.
Chapter Six: Investment Strategies and Future Scenarios
Faced with such treacherous circumstances, my current strategy is extremely cautious. I have already increased cash holdings to over 50% in my portfolio, and continue reducing positions that are overvalued or where conviction is shaky. In my view, the S&P 500 is likely to peak in early May, then fall below its key 21-day MA support. I have simulated two scenarios: first, the base case, where the index pulls back to the 5800 to 6100 range—a healthy 15%-20% correction; second, the optimistic scenario, if the index can stabilize between 6929 and 7158, the bull market may struggle to survive till the midterms in November.
But no matter the scenario, the current risk/reward for new entries is poor—it’s like snatching chestnuts from the fire.
Honestly, family, we don’t invest for a reputation, but for real account growth. Our VIP portfolio started in April 2022 and was launched just as the Nasdaq fell for a whole year, but we managed to deliver a 60% return under huge pressure that year.
Over these four years, our total returns quietly took first place out of 30 million users on Futu NiuNiu, growing 15 times over! That’s 24 times the S&P 500.
What makes me most proud isn’t how much we made, but that we precisely avoided the two crashes in 2022 and early 2025. If you don’t want to be the “chives being cut” anymore, just come join our group and earn steadily together towards financial freedom for real peace of mind! 📈

Disclaimer: The content of this article solely reflects the author's opinion and does not represent the platform in any capacity. This article is not intended to serve as a reference for making investment decisions.
You may also like
Syscoin (SYS) fluctuates 74.0% in 24 hours: Binance delisting warning triggers pump and sudden drop
ZKL (zkLink) fluctuates by 47.0% in 24 hours: Low liquidity market amplifies price swings
KAIO (KAIO) fluctuates 49.5% in 24 hours: Whale airdrop claim event and liquidity tightening drive the movement