thecryptobasic.com
Analyst Celal Kucuker has shared a bullish long-term chart for $XRP, arguing that the asset could eventually break into double-digit price levels.
The promising outlook is based on a large cup-and-handle formation developing on the weekly timeframe. Notably, the analysis comes at a time when $XRP’s bullish momentum is regaining steam. The coin recently touched the elusive $1.50 level before dipping below it.
Key Points
- $XRP shows a bullish cup-and-handle pattern, with analysts eyeing a potential breakout toward higher levels.
- Key resistance sits at $1.74 and $3.65, with a Fibonacci extension pointing to a long-term $12.10 target.
- $XRP has rebounded from $1.11 lows and is consolidating near $1.45 after briefly testing $1.50 resistance.
- Analysts expect a breakout if momentum holds, with short-term targets near $2 and possible new ATH above $4.
Analyst Sees Cup and Handle Breakout
In a post on X, Kucuker described the current setup as “the best $XRP chart”. The comment highlighted a technical formation that suggests $XRP may revisit the 1.618 Fibonacci extension level near $12.10 before the cycle ends.
The chart shows $XRP forming a large cup-and-handle pattern after its breakout rally in late 2024. The rounded bottom structure, followed by a downward-sloping consolidation phase, is a well-known bullish setup.
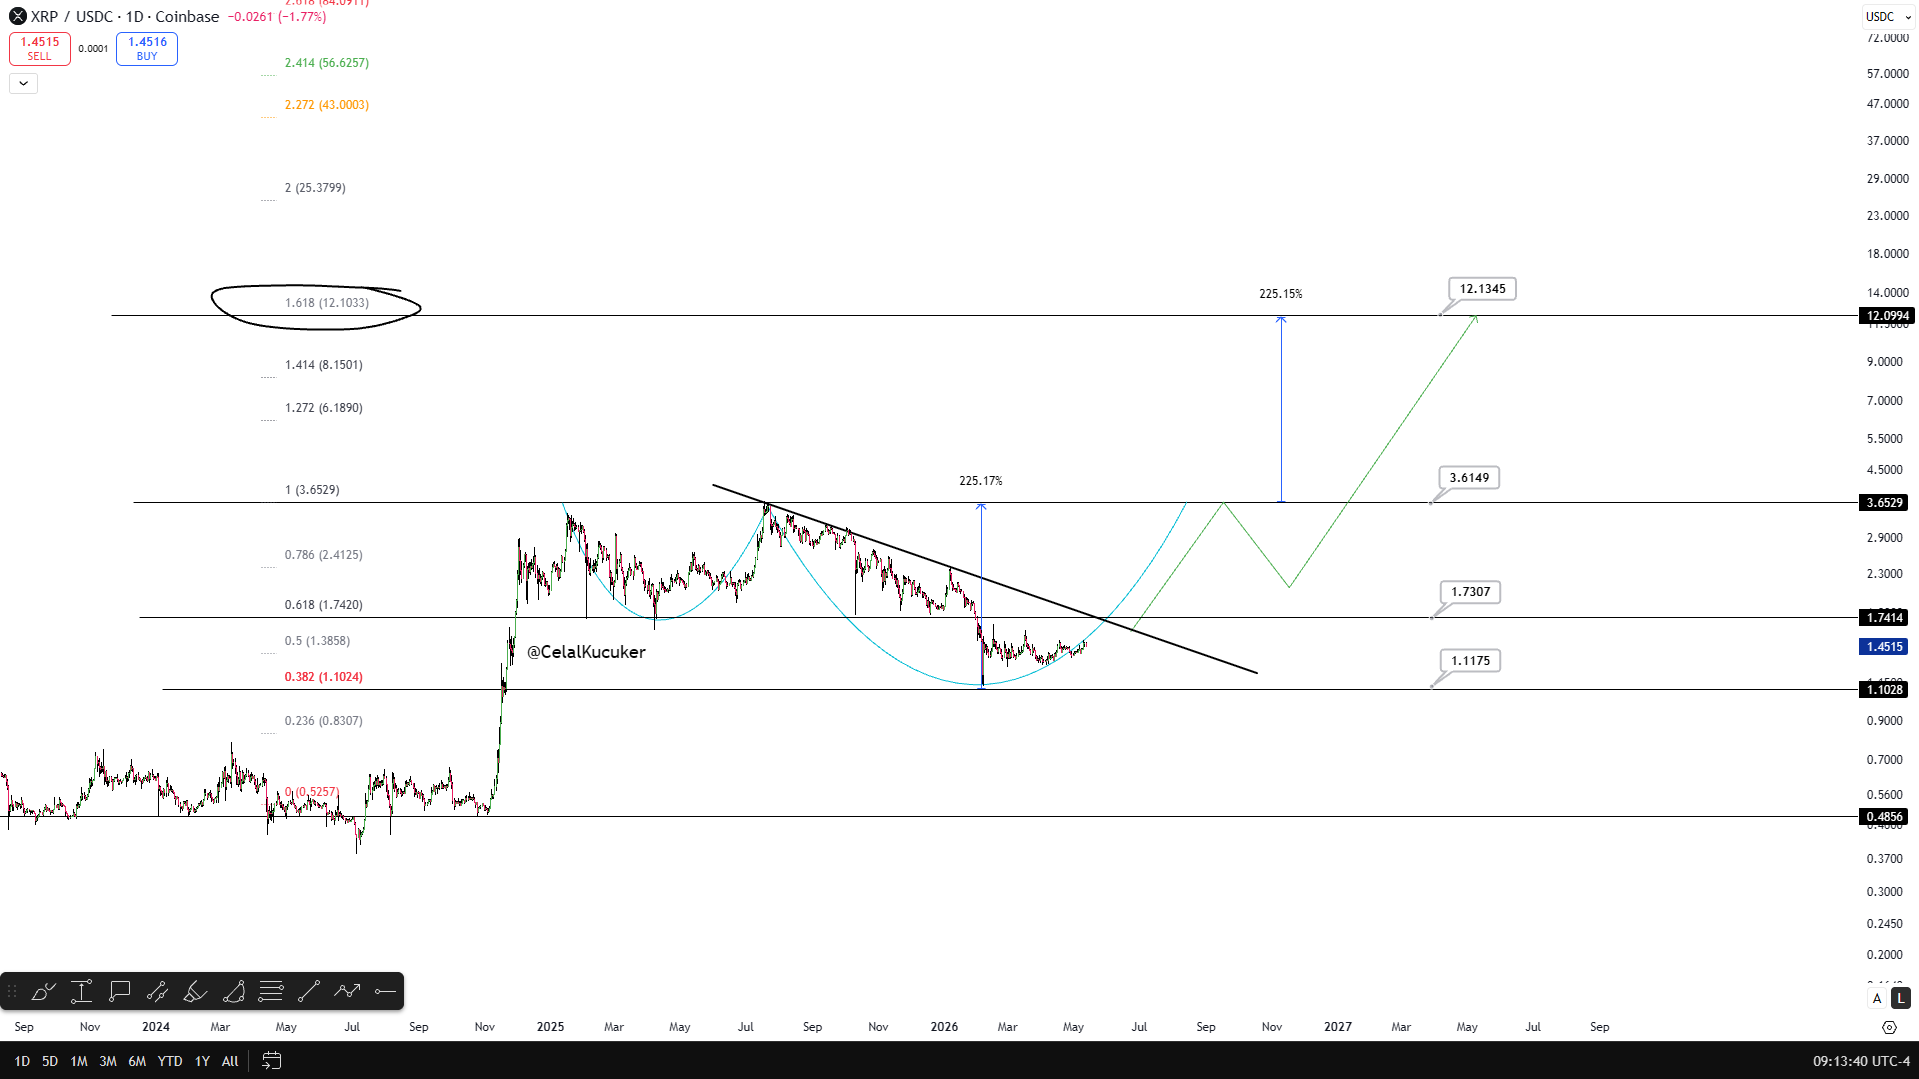
According to the analysis, $XRP now appears to be recovering from the handle portion of the pattern. Notably, the coin’s price dipped approximately 70% from its $3.65 peak, falling to $1.11.
$XRP has since rebounded from that low, touching $1.50 a couple of times before facing resistance. Kucuker’s analysis suggests that if momentum continues, the asset could enter a stronger breakout phase over the coming months.
Key $XRP Levels to Watch
Kucuker’s chart outlines several major Fibonacci levels that traders may monitor during $XRP’s next move.
The first key resistance level sits around $1.74, which aligns with the 0.618 Fibonacci retracement zone. Above that, the next major level appears near $3.65, an important breakout point and its previous cycle peak.
The analyst suggests that overcoming this stubborn resistance would open the door to a double-digit $XRP price. Specifically, he points to the 1.618 Fibonacci extension, which aligns with the $12.10 price level as the long-term target.
The projected move from the current range to that level represents a gain of more than 225%, based on the chart’s measurement.
At the time of writing, $XRP was trading around $1.45. The cryptocurrency has gained 1.87% over the past seven days and nearly 9.83% over the last month.
What Other Analysts Are Saying
Several other analysts also believe, based on various technical observations, that $XRP is set for a new breakout.
Trader Michael XBT recently predicted that $XRP’s “parabola will begin any day now” and that a new all-time high is likely this year. He pointed to $XRP’s tightening price structure as a sign of an imminent breakout.
His chart suggests $XRP could first move toward $2 before pushing higher later in the cycle. $XRP was trading around $1.41 at the time, after weeks of consolidation near $1.30.
Responding to criticism that a return to $1.80 would not be impressive compared to $XRP’s previous $3.65 peak, Michael said a new all-time high above $4 is likely this year, implying nearly 3x upside from current levels.
The analyst believes many traders are too focused on Bitcoin and are ignoring $XRP’s setup. He says the key resistance zone is between $1.80 and $2, with a breakout above that range potentially opening the door to $3 and a new price discovery phase.