
Sneak Attack or All-out Assault? Gold Holds the Midline, Crude Oil and Other Factors Lend Support, Dollar Sharpening Its Knives: Final Battle Scenario Leaked in Advance!

Huitong Network, May 14th—— On Thursday (May 14th), US oil, gold, the US Dollar Index, and US Treasury yields showed divergent trends, with the market seeking equilibrium between policy signals and supply-demand disturbances, resulting in increased short-term volatility. What factors are restraining gold's performance? What is the impact of US Treasury yield pullbacks on the broader market? Can the current US oil price stay above $100? What are the main drivers of the US Dollar Index’s current strength? What are the core focal points for cross-market linkages in the future?
On Thursday (May 14th), US oil, gold, the US Dollar Index, and US Treasury yields displayed divergent patterns. The US Dollar Index continued its rebound, holding above 98.55, supported by rising US inflation data and expectations of a Federal Reserve rate hike; US 10-year Treasury yields saw a short-term pullback, touching around 4.444 during the session (UTC+8); influenced by geopolitical factors, US oil remained in a narrow range above $100; gold fluctuated around the 4700 mark, generally showing wide-range oscillations. Cross-market linkages reveal a temporary divergence between the dollar and yields, and the geopolitical premium on oil prices has become a market focus. News of Trump’s visit to China today provides some support for risk assets, but the inflation trajectory and policy expectations remain the main variables. Overall, the market is seeking balance between policy signals and supply-demand disturbances, with short-term volatility on the rise.
Fundamental Environment: Intertwining Inflation Pressures and Geopolitical Factors
Latest economic data show that US Producer Price Index has risen significantly, and combined with Consumer Price data, market expectations for Federal Reserve policy tightening have strengthened. The US Dollar Index is thus supported, maintaining a strong short-term fluctuation. According to reports from major overseas media, the market still prices in a high probability that rates will remain unchanged at the June FOMC meeting, but the probability of a rate hike in December has risen significantly, which echoes the US Dollar Index trading between the middle and upper Bollinger bands near the 98.60–98.74 resistance zone.
For US oil, geopolitical conditions remain the core driver. Disruptions to the Strait of Hormuz, along with some shipping incidents, have pushed oil prices to maintain above $100. Although both sides agreed in meetings to keep the strait open, actual transit volume remains below the historical average, supporting an oil price rebound. US Treasury yields, affected by rate hike expectations, recently hit cycle highs with the 10-year yield before a short-term pullback, reflecting the market's game between inflation fears and policy outlooks. On the whole, fundamentals show that inflation and geopolitical factors together shape the current cross-market environment, with US Dollar strength and oil price resilience forming a linkage.
Technical Signals: Support-Resistance Zones and Indicator Resonance
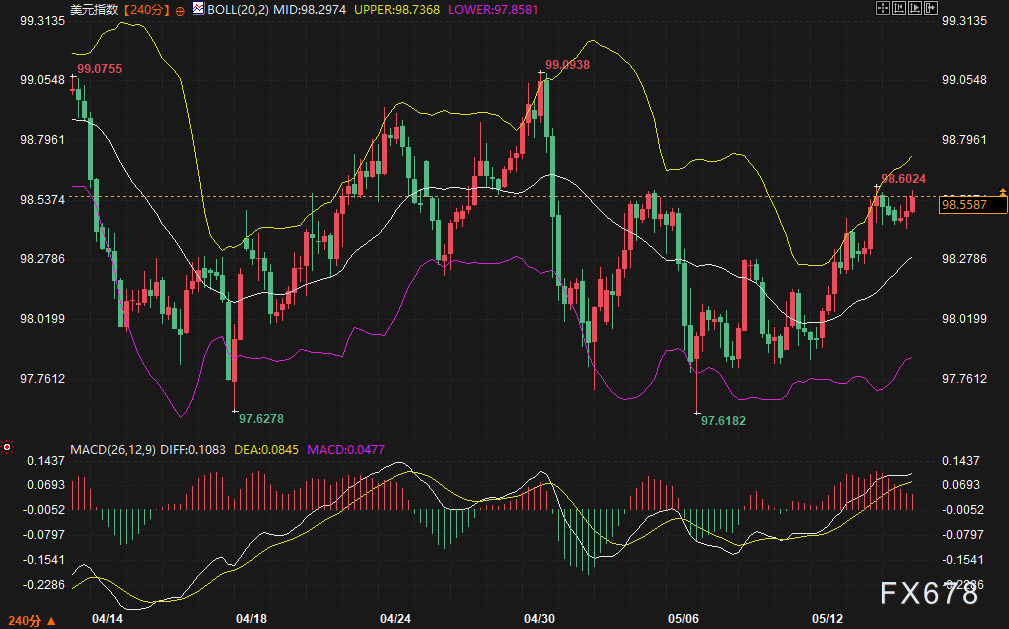
From a technical indicators perspective, each asset is showing clear divergent patterns. The US Dollar Index is currently quoted at 98.5587, trading between the middle Bollinger band (98.30) and the upper band (98.74), with the MACD red bar marginally released and DIFF crossing above DEA, showing a slight bullish bias but limited momentum. The 98.60-98.74 range forms short-term resistance, while 98.30 provides initial support.
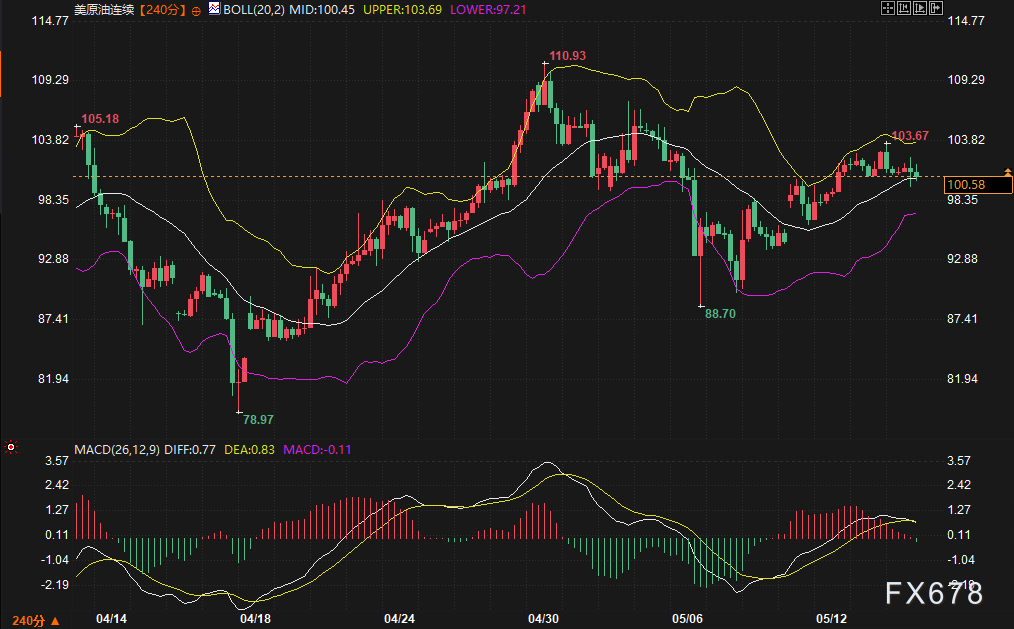
US oil is continuously quoted at 100.58 (UTC+8), hovering around the middle Bollinger band of 100.45, with the upper band at 103.69 serving as clear resistance and the lower band at 97.21 providing medium-term support. MACD shows DIFF and DEA nearly tangled, the green bar is extremely short, and the market is balanced, suggesting the short-term direction awaits further confirmation from fundamentals. The price is in a rebound correction channel, with effective support at the mid-band.
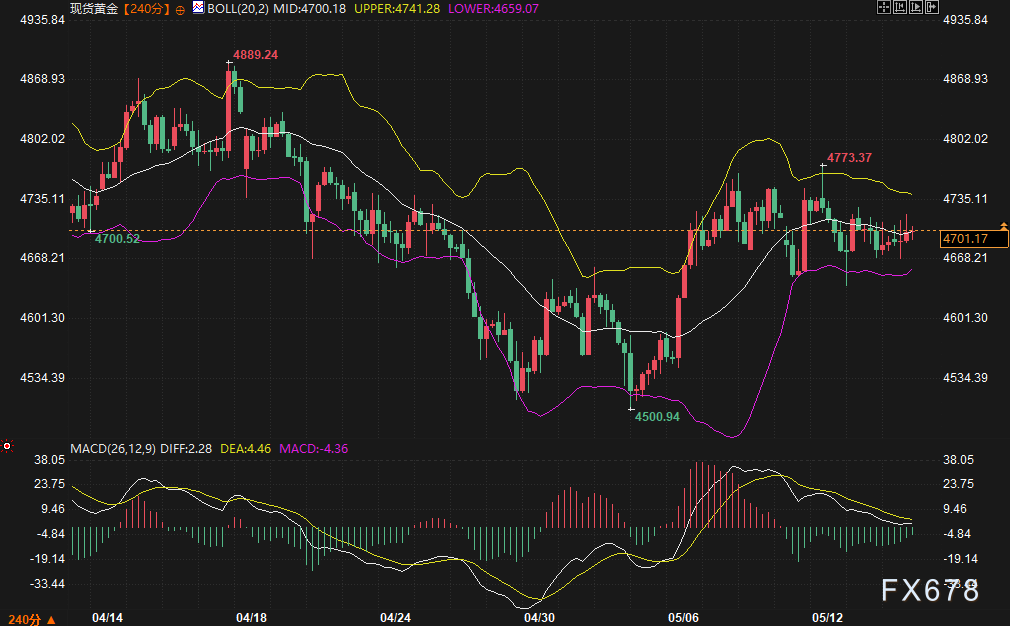
Gold is currently quoted at 4701.17 (UTC+8), near the middle Bollinger band at 4700.18, with the upper band at 4741 and the lower band at 4659 forming the fluctuation range. The MACD green bar continues to release but is narrowing in absolute value, downward momentum is waning, indicating that although bears hold the short-term advantage, a trend decline is difficult to form.
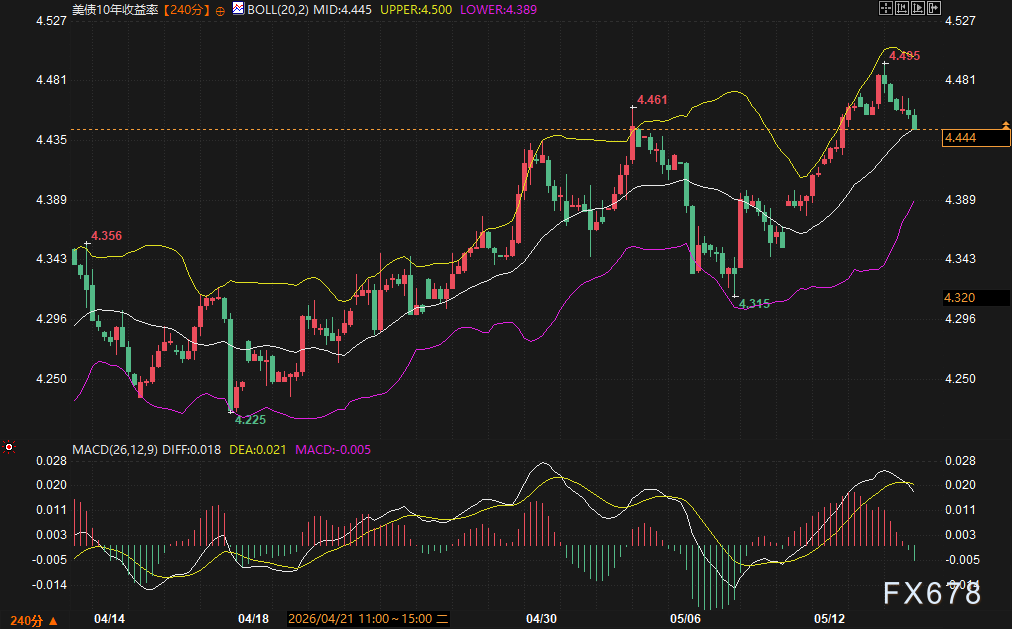
US 10-year Treasury yield is reported at 4.444 (UTC+8), just below the middle Bollinger band of 4.445 after running along the upper band previously, with MACD turning from red to green, showing short-term bullish fading. The middle band at 4.445 and lower band at 4.389 form potential support, with the upper band at 4.500 as key resistance.
Cross-Market Linkage: Asset Pricing Under Dollar Strength
The strength of the US Dollar Index has had clear transmission effects on other assets. Dollar appreciation usually suppresses gold, and the current gold price clinging to the middle band and the MACD green bar matches this characteristic. At the same time, a high-yield environment enhances the attractiveness of holding dollar assets, further strengthening the US Dollar Index above 98.50.
US oil and the dollar are showing phase divergence. Geopolitical premium grants oil prices some independent resilience, but if the dollar continues strengthening with heightened expectations of rate hikes, global demand expectations may indirectly constrain crude. US Treasury yield pullback gives the dollar some breathing room, hinting that the market is dynamically balancing inflation trades and growth concerns. Data show current cross-market correlations are elevated, and any marginal policy or geopolitical signals could amplify linkage effects.
Capital Conditions: Funding Rates and Liquidity Disturbances
US Treasury funding market data show GC opened 5bps softer than previous close at 3.59% (UTC+8), mainly due to a relatively low TGA balance and ample system cash. Coupled with sizable capital outflows tomorrow, the market anticipates an uptick in funding rates. RRP operation data show moderate participation; combined with SOFR futures and OIS pricing, the short-term liquidity environment remains stable, but policy trajectory under inflation expectations is still the main variable. These funding conditions provide micro support for Treasury yields and dollar trends and should be included in cross-market analysis frameworks.
Trend Outlook
Combining fundamentals and technical signals, the next 2-3 days are likely to see range-bound markets, watching for key level breakouts. The US Dollar Index is expected to maintain a strong fluctuation in the 98.30-98.74 area; if rate hike expectations heat up further, the upper band’s resistance may be tested. US oil seeks support above $100, with upward resistance near 103.69 and lower support in the 97-100 range; geopolitical news remains a primary catalyst. Gold is expected to continue fluctuating in the 4659-4741 range, with the middle band at 4700 as a crucial point. US 10-year Treasury yields still face near-term pullback risks, with support in the 4.389-4.445 area and a key break of 4.500 required to confirm trend continuation.
The overall logic is self-consistent: inflation trajectory dominates dollar and yield pricing, geopolitical factors grant oil price stage resilience, and gold seeks a balance between safe-haven demand and dollar suppression. The market will continue evaluating the follow-up to meetings and liquidity dynamics, with volatility expected to remain at current levels and higher sensitivity to marginal changes in data or headlines affecting cross-asset linkages.
Frequently Asked Questions
What are the main drivers of the current strength of the US Dollar Index?
The recent rebound in the US Dollar Index mainly stems from above-expectation US inflation data and a rising probability of a Fed rate hike. Producer Price Index and other data have raised market pricing for policy tightening; technically, the price is trading between the middle and upper Bollinger bands, with the MACD red bar slightly released—bulls dominate but full momentum has not yet materialized. Over the next 2-3 days, the 98.60-98.74 area is the key resistance, and one should monitor the evolution of inflation expectations.
Can the current US oil price stay above $100?
US oil is quoted near 100.58 (UTC+8), with the Bollinger mid-band providing obvious support and geopolitical events—especially those concerning the Strait of Hormuz—underpinning price resilience. MACD shows balance; the short-term direction depends on news validation. Upside pressure lies at 103.69, with downside support at 97.21. The consensus on maintaining the open status of the Strait in recent talks stabilizes market sentiment somewhat, but actual transit conditions require ongoing tracking.
What factors are restraining gold’s performance?
Gold is currently trading near the 4700 mid-band, the MACD green bar is releasing but with waning momentum, showing a choppy pattern. The strength of the US Dollar Index is the main drag, while the yield environment also affects gold’s safe-haven appeal. The short-term range is 4659–4741, with the mid-band as an important observation point. For the next 2-3 days, expect continued broad swings, watching the interplay between the dollar and yields.
What is the impact of US Treasury yield pullbacks on the broader market?
The 10-year yield was 4.444 (UTC+8), briefly dropping below the middle Bollinger band, and MACD turned from red to green, showing fading bullishness. Downside support is seen at 4.389–4.445. This pullback gives the dollar some breathing space and relieves some asset funding pressure, but inflation expectations still limit the space for yields to fall. From a cross-market perspective, the temporary divergence between yields and the dollar warrants continued attention.
What are the core focal points for cross-market linkages in the next 2-3 days?
Focus on the interaction between the dollar and yields, the sustainability of US oil's geopolitical premium, and changes in gold’s sensitivity to the dollar. On the funding side, GC funding rate movements and SOFR pricing also provide auxiliary signals. Given the overall environment, the probability of oscillation is high, and any marginal changes in inflation data, geopolitical developments, or policy signals could trigger adjustments in asset linkages. Investors should remain cautious and observe the effectiveness of key supports and resistances according to their own risk preferences.
Disclaimer: The content of this article solely reflects the author's opinion and does not represent the platform in any capacity. This article is not intended to serve as a reference for making investment decisions.
You may also like
CLARITY Act Review Calls for Ban on Federal Crypto Bailouts

WAI (World3) fluctuated 45.2% in 24 hours: price rebounded from a low of $0.02046 to a high of $0.0297
$DEGEN 24-hour volatility reaches 41.5%: Meme coin sector pulls back with no specific catalyst
Swiss Franc dips as strong US data, hawkish Fed commentary support Dollar