'Not all 200-day moving averages are equal': K33 argues February's $60K low still marks cycle's maximum drawdown

Bitcoin (BTC) has dropped around 6% since revisiting its 200-day moving average near $82,000 earlier this month, after first breaking below the indicator in November. Nevertheless, February's bottom of around $60,000 still marks this cycle's maximum drawdown, according to analysts at research and brokerage firm K33.
The rejection has reignited debate over whether another leg down lies ahead, K33 Head of Research Vetle Lunde noted in a new report, amid concerns the current move could mirror rallies in 2014, 2018, and 2022 that ultimately led to fresh lows.
However, the current pattern looks different, in Lunde's view, with bitcoin spending 189 days between the November 200-day moving average breakdown and May retest — far longer than the 96, 132, and 85 days seen in those prior cycles. Bitcoin also remains more than 20% down during that period compared to positive returns in 2014 and 2022 and a shallower drawdown of around 8% in 2018, Lunde noted, with the 200-day moving average trending higher in those years, but lower in 2026.
"Past rallies recovered quickly, rebuilding risk appetite and leverage and setting up the unwind that fueled the next leg lower," Lunde wrote. "The current slow grind has not."
K33 also highlighted derivatives data pointing to "uniquely pessimistic sentiment," with the firm's framework tracking closer similarities to strong periods such as March and April 2025 than to past bear market rallies.
"We maintain our view that the less aggressive bull market of 2025 sets the stage for a more moderate bear market in 2026, with our base case staying that $60k in February marked this cycle's maximum drawdown," Lunde said.
Defensive positioning shows up in institutional flows
That cautious positioning is also showing up in exchange-traded fund and institutional flow data, with K33 arguing that the current market lacks the leverage build-up typically seen during prior bear market rallies.
Following the latest set of 13F disclosures, Q1 positions are now public, with institutional participants reducing their BTC exposure by 26,733 BTC, while retail participants increased it by 19,395 BTC, according to K33's data.
Delta-neutral firms such as Millennium and Jane Street accounted for most of the reduced institutional exposure, Lunde said, likely caused by compressing crypto yields, substantial volatility, and opportunities in alternative commodity markets following the Iran escalations.
Meanwhile, bitcoin exchange-traded products recorded their 9th largest 5-day outflow since the launch of U.S. spot ETFs 600 trading days ago — representing the bottom 1.5% of flow days, per K33, as bitcoin's price approached the average BTC ETF cost basis.
The firm found that the likelihood of a bottom 5% flow day climbs to 10.2% in weeks where bitcoin crosses the cost basis, and the likelihood of a bottom 10% flow day climbs to 16.1% in weeks where bitcoin has traded within 5% of its cost basis. However, in periods where bitcoin trades more than 15% above the cost basis, the likelihood of a bottom 5% flow day sits at just 3%, it noted.
"In other words, heavy outflow days are far more common when BTCUSD trades close to its cost basis," Lunde said. "We attribute this to market participants seeking to avoid losses or to limit losses after a deep drawdown."
Disclaimer: The content of this article solely reflects the author's opinion and does not represent the platform in any capacity. This article is not intended to serve as a reference for making investment decisions.
You may also like
White-label prop firm technology vs custom development
JPMorgan tests XRP Ledger without XRP as settlement currency
Pi Network Completes Major v23 Node Upgrade Following Complex Infrastructure Overhaul

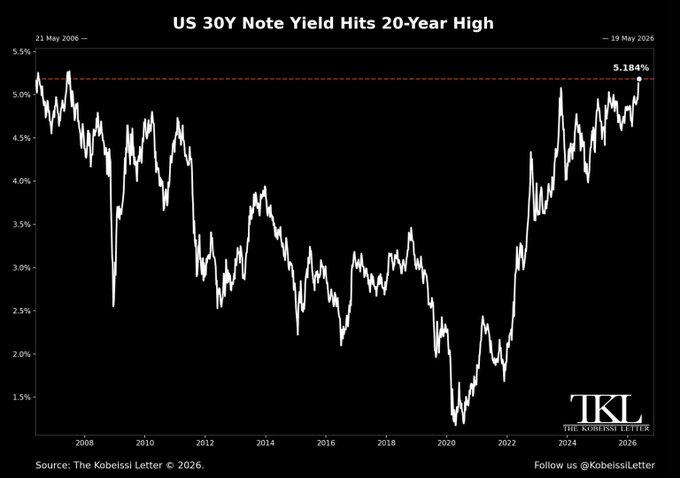
U.S. Treasury Yields Hit Multi-Year Highs as Inflation Pressure Intensifies