 thecryptobasic.com
Shiba Inu has taken another leg down on the weekly chart to test a major support region after spending months hovering near historic lows.
Notably, this Shiba Inu ($SHIB) trend is within a contrasting descending triangle that has suppressed price action since the 2021 peak. While conditions remain bearish, the recent setup suggests that the prolonged correction phase may be nearing its end.
Key Points
- Shiba Inu is within a contrasting descending triangle that has suppressed price action since the 2021 peak.
- $SHIB has taken another leg lower on the weekly chart, testing a major support region.
- One of the more important signals on the chart is the repeated defense of the current support area.
- Shiba Inu recently completed an ABC corrective wave amid the ongoing downtrend.
- Analysis points to a possible recovery scenario if buyers can regain momentum and push $SHIB higher.
$SHIB Holds Critical Long-Term Support Zone
Analyst Aurex Finance shared this weekly chart update in a recent TradingView analysis. The commentary highlighted that the recent correction, which has seen $SHIB decline by 10% in the past seven days, has retested the key support area around $0.00000550. This aligns closely with multi-year levels that have cushioned prices since Shiba Inu’s early days in 2021.
However, the analysis highlighted that one of the more important signals on the chart is the repeated defense of the current support area. Despite persistent weakness across the broader crypto sector, sellers have struggled to force a sustained breakdown beneath the demand zone. This indicates that downside momentum may be slowing.
At the same time, the upper resistance trendline of a broader descending triangle continues acting as the dominant barrier. Every major recovery attempt since 2021 has preceded a rejection near this falling resistance, keeping the broader structure under pressure. Until $SHIB can push above that upper boundary, the long-term chart remains technically fragile.
Still, the narrowing structure of the triangle shows that volatility has been compressing for an extended period. Historically, these types of formations often precede a larger directional move once prices finally escape the range.
Shiba Inu Correction Near Completion?
Meanwhile, the analysis also outlines a completed Elliott Wave pattern labeled A, B, and C amid the ongoing downtrend. The first wave triggered the initial decline from the March 2024 high of $0.0000456 to $0.0000107 in August 2024.
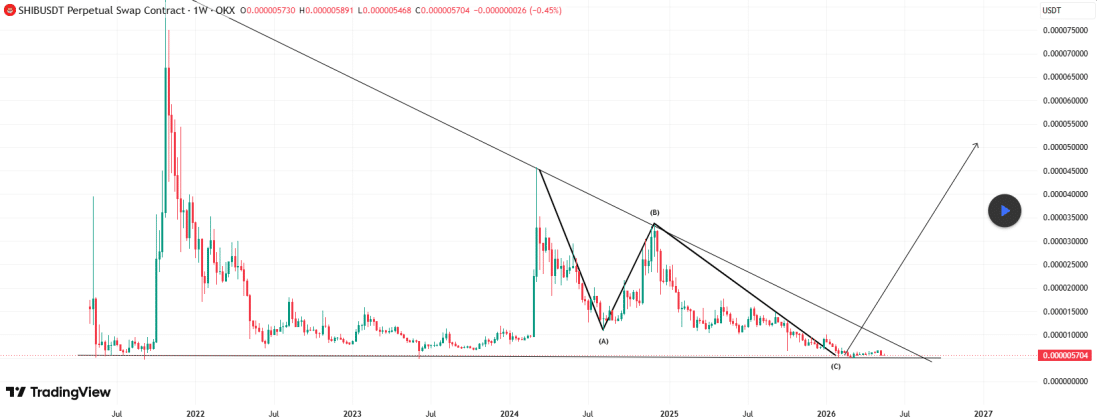 Shiba Inu ABC Elliott Wave Pattern/Aurex Finance
Wave B produced a temporary recovery that failed beneath descending resistance. $SHIB rose from the August 2024 lows to $0.0000334 in December 2024. Wave C then extended lower, pushing $SHIB back toward the triangle’s lower edge, where the price is currently stabilizing.
The completed A-B-C correction appears to end directly at higher timeframe support, creating a technical confluence zone near the recent lows. Aurex Finance believes that the combination suggests that $SHIB may be entering the late stages of its multi-year corrective cycle.
As such, the market watcher points to a possible recovery scenario if buyers can regain momentum and push $SHIB higher. The first area of interest is the descending trendline currently near $0.000011. Another area to watch is the previous B-wave high around $0.000033. A decisive move above these two areas changes the market structure and gives control to the bulls.
For now, $SHIB trades near historic lows, changing hands at $0.00000563 at press time. Spot trading volume has dropped by 20%, while open interest has increased by 2.3% in the past 24 hours, sending mixed signals.
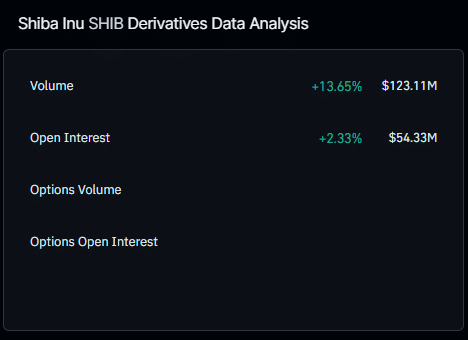 Shiba Inu Open Interest/Coinglass