
Bank of America Hartnett: What to Trade When the Bubble Bursts?

On May 31, Bank of America Securities Chief Investment Strategist Michael Hartnett analyzed the modern super bubble in his latest Flow Show and explained his view on trading strategies following the potential bursting of the current bubble.
Hartnett pointed out that the standard operation after a bubble bursts is to go long on bonds, go long on severely undervalued defensive sectors, and position potential assets the market has "undervalued".
June will usher in a densely packed risk window for events, including the U.S. CPI data, European Central Bank rate hike, G7 Summit, and the Federal Reserve's FOMC meeting—any of which could act as a catalyst for the bubble to burst.
Bubble Warning Signals Flashing Red
Hartnett emphasized that although the S&P 500 Index is at an all-time high, 222 component stocks are down over 20% from their historical highs, and 109 are down over 40%.
Beneath the apparent strength of the index, only 21 stocks—about 4% of the index's constituents—are at record highs, a figure almost identical to the 20 stocks at the peak of the dot-com bubble in 2000.
The situation in emerging markets is even more extreme: out of 1,224 component stocks, only 21 (about 2%) are at all-time highs.
Hartnett also noted that the S&P 500's rolling P/E ratio has reached 29 times, with market valuation built on extremely optimistic earnings forecasts, posing substantial downside risk.
On the technical side, the Bank of America Bull & Bear Indicator rose to 8.5 this week from 8.0 last week, mainly driven by inflows into high-yield and emerging market bonds, rapidly approaching record highs.
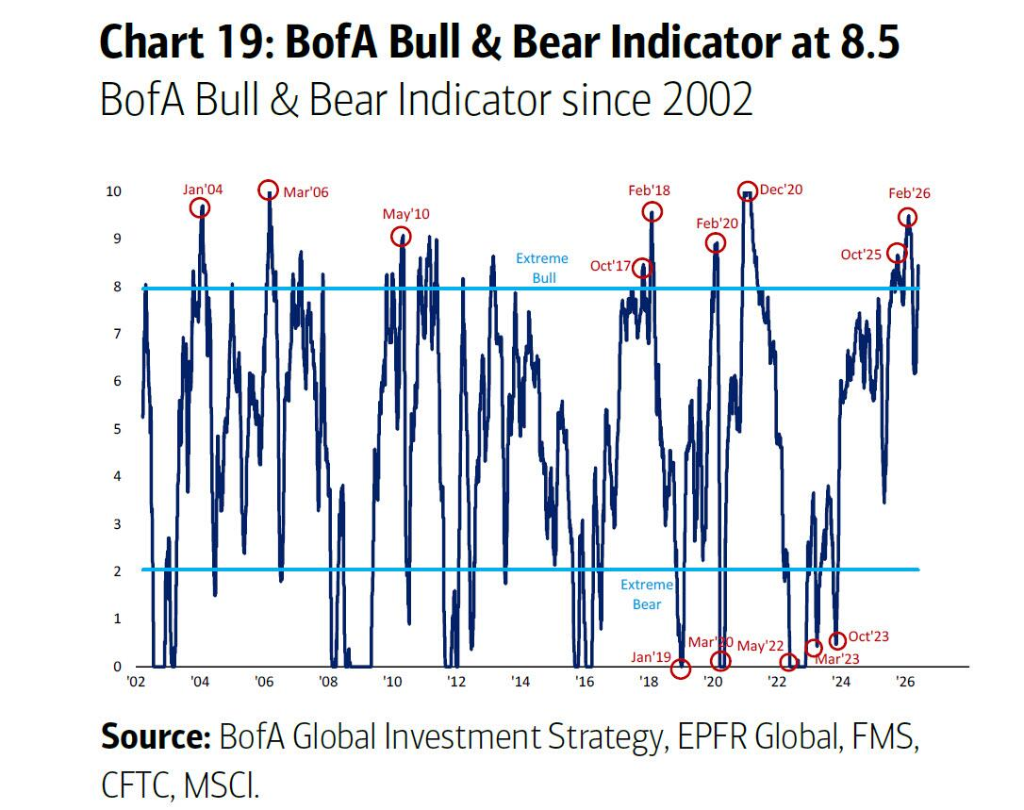
In addition, Bank of America’s global breadth rule is also nearing the “overbought” range.
Since 2002, this indicator has triggered 17 sell signals, which corresponded to subsequent average declines of 2%–3% in global equities over the following 2–3 months, with maximum drawdowns reaching 15%–20%.
The Common Patterns of Four Major Historical Bubbles
By reviewing four significant bubbles since 1929, Hartnett summarized the market patterns after a bubble bursts.
Go long on bonds (especially in the six months after the market tops out, with 10-year yields dropping an average of about 50 basis points), and go long on defensive sectors and undervalued assets that lagged significantly during the late-stage bubble. In other words, "go long the humbled and short the arrogant."
The Roaring Twenties (1929): The bubble was led by utilities, telecomms, industrial, and banking sectors, peaking on September 3, 1929.
Within six months after the bubble burst, utilities, industrials, and banks underperformed significantly, while the previously weak energy sector staged a strong rebound.
Japan’s Late 1980s Bubble: Characterized by easy credit and a land price bubble, led by finance, real estate, and construction, peaking on December 29, 1989.
After the bubble burst, property and bank stocks suffered the deepest declines, while yen depreciation propelled export-oriented sectors (autos and electronics) to sustained outperformance.
The Late 1990s Internet Bubble: The Nasdaq doubled in the six months prior to its March 10, 2000 peak and then plunged 60% within a year.
In the meantime, previously neglected defensive sectors strongly rebounded: utilities rose 25%, consumer staples climbed 24%, and the S&P 500 equal-weight index closed higher for the year 2000.
China's 2007 Bull Market: Materials, industrials, and financials rose 2–3x in the 12 months before the peak, then all plummeted 65%–85% over the following year.
Defensive and growth sectors that had lagged (consumer staples, utilities, technology) significantly outperformed.
The Trading Roadmap for the Current Bubble
Based on these historical patterns, Hartnett makes a judgment on the current post-bubble market structure.
Since the S&P 500's low in April 2026, the Nasdaq is up more than 80%, while the most obvious underperformers have been defensive sectors—consumer staples, financials, and healthcare.
Hartnett believes these sectors will be the first to rebound after the bubble bursts, and is also bullish on consumer stocks impacted by oil prices, as well as the Indian and European markets.
On the AI investment theme, Hartnett anticipates the dominant logic of the AI industry chain to shift.
From the current focus on "spenders" with large-scale capital expenditures and "builders" like chip manufacturers, to "users and adopters" of applications.
Currently, tech companies account for 10% of the investment-grade bond market and 8% of the high-yield bond market.
He believes this trend is best captured via small-cap tech/growth stocks—similar to market developments after the Nifty Fifty bubble burst in the late 1970s.
Additionally, Hartnett especially notes that alternative asset managers with robust financials and no reliance on leverage will be best placed to profit from undervalued "potential assets" after the bubble bursts. These assets may be the best performers over the next 12 months.
June: Risk Window Packed with Catalysts
Hartnett characterizes June as a month of “highly concentrated” event risk, where any single event could ignite the markets. Specific events include:
- June 10 (UTC+8): U.S. CPI data—Hartnett expects a year-on-year increase of 4%;
- June 11 (UTC+8): European Central Bank rate decision;
- June 15 (UTC+8): G7 Summit;
- June 16 (UTC+8): Bank of Japan’s monetary policy meeting;
- June 17 (UTC+8): New Fed Chair Walsh to chair his first FOMC meeting and press conference;
- And June 18 (UTC+8): UK by-elections.
- Meanwhile, a large wave of stock issuance is also expected during the month.
Hartnett points out that with both long positions and earnings expectations at extreme levels, this is a time to consider taking profits and be cautious of rising yields and further upside in stocks.
To quote Baron Rothschild’s classic saying, “Buy when there’s blood in the streets, sell when there’s the sound of trumpets.”
In Hartnett’s view, the trumpet call may already be near.
Disclaimer: The content of this article solely reflects the author's opinion and does not represent the platform in any capacity. This article is not intended to serve as a reference for making investment decisions.
You may also like
Crypto rally: Why Humanity, Worldcoin, FET, and Venice Token are soaring

Sui faces outages, KEY support test, and 23.78mln unlock – Trouble ahead?

Shiba Inu Price Analysis: What Would It Take for SHIB to Reach $0.0001?

XDC rebounds from a key support – Will THIS help price reach $0.037?

Trending news
MoreCrypto prices
More





