
Analyst Predicts Biggest Bitcoin Bull Trap Of The Cycle, Calls Out 50% Crash To $42,000

By:Newsbtc
Bitget offers one-stop trading for cryptocurrencies, stocks, and gold. Trade now!
A welcome pack worth 6200 USDT for new users! Sign up now!
Bitcoin’s price recovery is not a new beginning: it is a familiar ending. That is the warning from a crypto analyst, who is of the notion that the current Bitcoin price action is playing out a bull trap the market has seen before and that the setup is pointing to a destination that sees the cryptocurrency crashing by almost 50% from current price levels.
Bitcoin Mirrors Key Stepping Stones From 2022 Bear Cycle
Chiefy’s analysis centers on a structural comparison between Bitcoin’s current price sequence and the step-by-step decline that defined the 2022 bear market. The framework identifies a pattern of bear cycle stepping stones, which is a series of lower highs and lower lows dressed up as recoveries on the weekly candlestick timeframe chart.
This analysis is in reference to Bitcoin’s price action since it broke above $82,000 earlier in the week. Bitcoin is pressing into the 1-day 200 moving average, a zone that has already acted as resistance during a previous failed recovery attempt in January 2026.
var rnd = window.rnd || Math.floor(Math.random()*10e6); var pid607465 = window.pid607465 || rnd; var plc607465 = window.plc607465 || 0; var abkw = window.abkw || ''; var absrc = 'https://servedbyadbutler.com/adserve/;ID=172179;size=0x0;setID=607465;type=js;sw='+screen.width+';sh='+screen.height+';spr='+window.devicePixelRatio+';kw='+abkw+';pid='+pid607465+';place='+(plc607465++)+';rnd='+rnd+';click=CLICK_MACRO_PLACEHOLDER'; document.write('
');
if (!window.AdButler){(function(){var s = document.createElement("script"); s.async = true; s.type = "text/javascript";s.src = "https://servedbyadbutler.com/app.js";var n = document.getElementsByTagName("script")[0]; n.parentNode.insertBefore(s, n);}());}
var AdButler = AdButler || {}; AdButler.ads = AdButler.ads || []; var abkw = window.abkw || ""; var plc366606 = window.plc366606 || 0; (function(){ var divs = document.querySelectorAll(".plc366606:not([id])"); var div = divs[divs.length-1]; div.id = "placement_366606_"+plc366606; AdButler.ads.push({handler: function(opt){ AdButler.register(172179, 366606, [728,90], "placement_366606_"+opt.place, opt); }, opt: { place: plc366606++, keywords: abkw, domain: "servedbyadbutler.com", click:"CLICK_MACRO_PLACEHOLDER" }}); })();
The analyst also pointed to the 1-week 200 moving average at the lower support region and the 1-month 350 moving average below it, suggesting that a breakdown could force BTC through multiple long-term trend levels before finding a stronger base.
This is exactly like the 2022 bear market. In the previous bear cycle, Bitcoin did not fall in a straight line. It produced relief rallies that looked convincing enough to pull traders back in, only for the price to roll over again.
BTCUSD now trading at $80,358. Chart:
Based on this view, the current rebound to the $80,000 range is not the start of a lasting breakout. It is the largest bull trap of the cycle. His projected path after the bull trap will see Bitcoin leave $82,000 and then go on a free fall to $50,000, then recover to $63,000, and finally crash to $42,000 again.
var rnd = window.rnd || Math.floor(Math.random()*10e6); var pid607472 = window.pid607472 || rnd; var plc607472 = window.plc607472 || 0; var abkw = window.abkw || ''; var absrc = 'https://servedbyadbutler.com/adserve/;ID=172179;size=0x0;setID=607472;type=js;sw='+screen.width+';sh='+screen.height+';spr='+window.devicePixelRatio+';kw='+abkw+';pid='+pid607472+';place='+(plc607472++)+';rnd='+rnd+';click=CLICK_MACRO_PLACEHOLDER'; document.write('
');
if (!window.AdButler){(function(){var s = document.createElement("script"); s.async = true; s.type = "text/javascript";s.src = "https://servedbyadbutler.com/app.js";var n = document.getElementsByTagName("script")[0]; n.parentNode.insertBefore(s, n);}());}
var AdButler = AdButler || {}; AdButler.ads = AdButler.ads || []; var abkw = window.abkw || ""; var plc452518 = window.plc452518 || 0; (function(){ var divs = document.querySelectorAll(".plc452518:not([id])"); var div = divs[divs.length-1]; div.id = "placement_452518_"+plc452518; AdButler.ads.push({handler: function(opt){ AdButler.register(172179, 452518, [728,90], "placement_452518_"+opt.place, opt); }, opt: { place: plc452518++, keywords: abkw, domain: "servedbyadbutler.com", click:"CLICK_MACRO_PLACEHOLDER" }}); })();
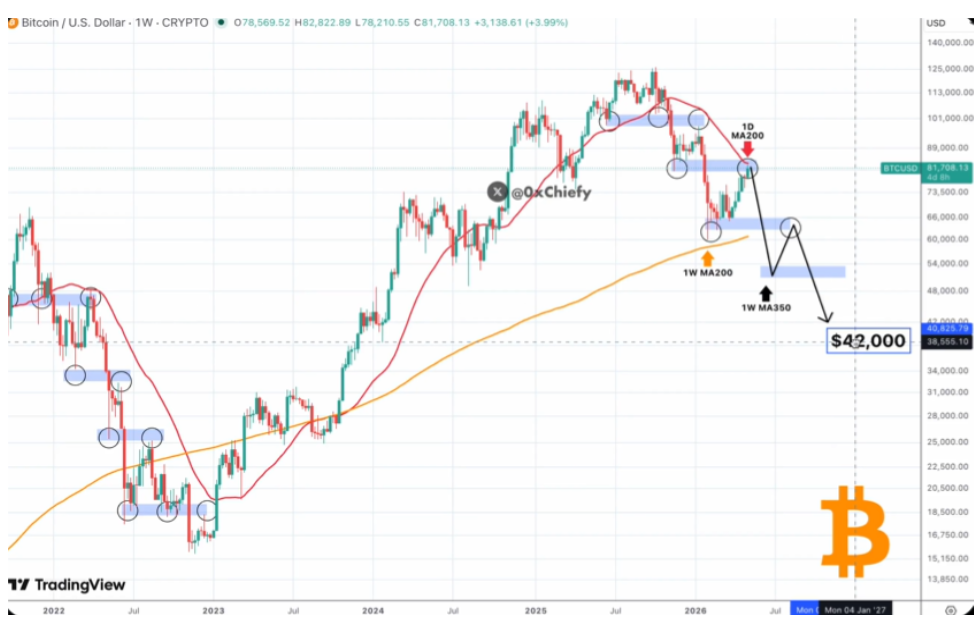
Bitcoin Price Chart. Source: @0xChiefy On X
Why This Rally Cannot Be Trusted
The next move in the sequence, a crash to $50,000, would represent a decline of approximately 39% from current levels. The subsequent bounce to $63,000 would restore confidence briefly before the final descent to $42,000 completes the pattern. This final descent will translate to an almost 50% crash from current levels.
var rnd = window.rnd || Math.floor(Math.random()*10e6); var pid607473 = window.pid607473 || rnd; var plc607473 = window.plc607473 || 0; var abkw = window.abkw || ''; var absrc = 'https://servedbyadbutler.com/adserve/;ID=172179;size=0x0;setID=607473;type=js;sw='+screen.width+';sh='+screen.height+';spr='+window.devicePixelRatio+';kw='+abkw+';pid='+pid607473+';place='+(plc607473++)+';rnd='+rnd+';click=CLICK_MACRO_PLACEHOLDER'; document.write('
');
if (!window.AdButler){(function(){var s = document.createElement("script"); s.async = true; s.type = "text/javascript";s.src = 'https://servedbyadbutler.com/app.js';var n = document.getElementsByTagName("script")[0]; n.parentNode.insertBefore(s, n);}());}
var AdButler = AdButler || {}; AdButler.ads = AdButler.ads || []; var abkw = window.abkw || ''; var plc452519 = window.plc452519 || 0; (function(){ var divs = document.querySelectorAll(".plc452519:not([id])"); var div = divs[divs.length-1]; div.id = "placement_452519_"+plc452519; AdButler.ads.push({handler: function(opt){ AdButler.register(172179, 452519, [728,90], 'placement_452519_'+opt.place, opt); }, opt: { place: plc452519++, keywords: abkw, domain: 'servedbyadbutler.com', click:'CLICK_MACRO_PLACEHOLDER' }}); })();
Interestingly, CryptoQuant researchers warned that Bitcoin’s apparent demand metric, which tracks 30-day changes in estimated on-chain spot buying activity, stayed negative throughout April’s entire price rally. This shows that the late April and early May move that took Bitcoin to $80,000 was mostly due to higher perpetual futures demand, which is exactly like 2022’s bear market onset.

Altcoins Aren’t Going Anywhere — Even After Brutal Crashes: Arthur Hayes
The crash warning is also coming at a time when Bitcoin ETF flows are no longer offering a clean bullish background, as they have now posted consistent net outflows of a total of $423.15 million in the past two days.
At the time of writing, Bitcoin is trading at $80,367.
Featured image from Unsplash, chart from TradingView
0
0
Disclaimer: The content of this article solely reflects the author's opinion and does not represent the platform in any capacity. This article is not intended to serve as a reference for making investment decisions.
Understand the market, then trade.
Bitget offers one-stop trading for cryptocurrencies, stocks, and gold.
Trade now!
You may also like
Ethereum loses over 35 percent against BTC in one year
Cointurk•2026/05/10 18:00
Weekly Tokenization Roundup: Bullish Buys Equiniti for $4.2B, Ondo Settles With JPMorgan, RWA Crosses $20B
BlockchainReporter•2026/05/10 18:00
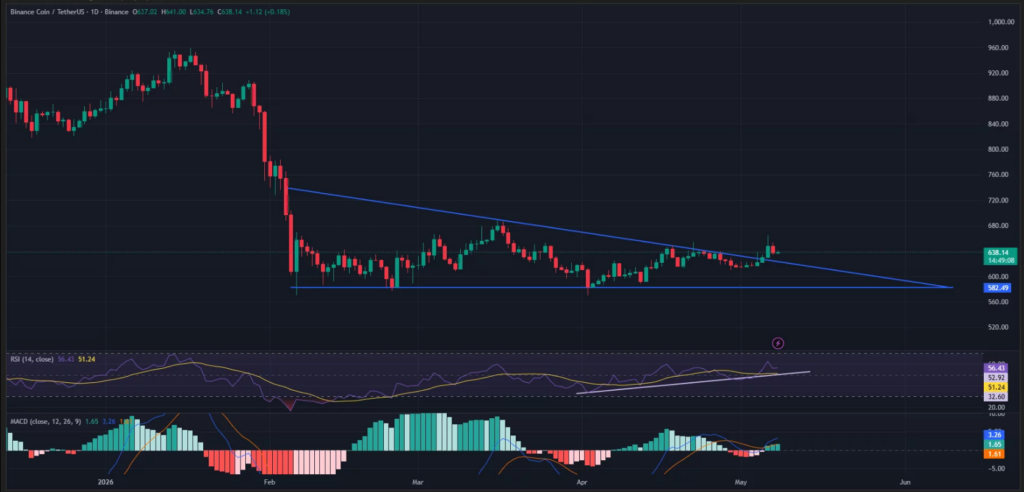
BNB Price Breakout Signals Recovery After Months of Pressure
Cryptonewsland•2026/05/10 17:33
Can APEMARS Turn $1K Into $52K With ROCKET250 Bonus at Stage 20 as the Best Crypto to Buy Now While Hedera And Toncoin Surge?
BlockchainReporter•2026/05/10 17:15

Trending news
MoreCrypto prices
MoreBitcoin
BTC
$81,440.25
+0.77%
Ethereum
ETH
$2,363.98
+1.42%
Tether USDt
USDT
$0.9998
+0.01%
XRP
XRP
$1.5
+5.71%
BNB
BNB
$659.99
+1.55%
USDC
USDC
$0.9996
-0.01%
Solana
SOL
$96.22
+3.22%
TRON
TRX
$0.3519
+0.48%
Dogecoin
DOGE
$0.1110
+1.29%
Hyperliquid
HYPE
$43.62
+1.50%
How to buy BTC
Bitget lists BTC – Buy or sell BTC quickly on Bitget!
Trade now
Become a trader now?A welcome pack worth 6200 USDT for new users!
Sign up now