
US April CPI Year-on-Year at 3.8%, No Need for Panic at All

My new book "Overcoming the Natural Interest Rate Trap" has been published, introduction available.It is recommended to purchase genuine copies via Tmall and JD.com.
At 20:30 on May 12, East 8th District time, the U.S. Bureau of Labor Statistics released the April CPI data. April CPI month-on-month was 0.9% (previous value 1%), year-on-year 3.8% (previous value 3.3%); core CPI (excluding energy and food) was up 0.4% month-on-month, 2.8% year-on-year (previous value 2.6%).
The market became excited; not only was the Federal Reserve's rate cut expected to be postponed, but some even forecast a rate hike (I suspect it's the same group who anticipated a rate hike in mid-March), and used this as one of the reasons for the U.S. tech stocks falling that night, saying that rate hikes would hit tech stock valuations, etc.
In short, there was a bit of panic.
From my perspective, this is pure nonsense and completely unnecessary.
I. Energy Prices Are Indeed Being Passed Downward
Recall, on April 21 Federal Reserve's new Chairman Kevin Warsh said at a Senate hearing, "I tend to use so-called trimmed averages, which remove all tail risks."
At that time, Cleveland Fed's Median CPI(median CPI), Trimmed Mean CPI(trimmed-mean CPI), and Dallas Fed's Trimmed Mean PCE(Trimmed Mean PCE).These can also all be described as core CPI.
Cleveland Fed's Median CPI (median CPI) sorts consumer goods published by the U.S. Department of Labor by price change, then takes the 50th percentile item, weights according to expenditure weight, to get the monthly CPI.
16% Trimmed Mean CPI (trimmed-mean CPI) sorts consumer goods published by the U.S. Department of Labor by price change, selects those above the 8th percentile and below the 92nd percentile, weights by expenditure, to get the CPI.
These two indicators are used to replace the current core CPI (excluding energy and food). Cleveland Fed believes they reflect underlying inflation trends better than the core CPI (excluding energy and food).
So, what were the Median CPI and Trimmed Mean CPI for April?
Figure 1 shows that CPI month-on-month for March and April was 1.0% and 0.9%, obviously impacted by rising oil prices. Core CPI (excluding energy and food) was 0.3% and 0.4% month-on-month, with April higher, indicating energy price hikes are indeed being passed to other consumer goods. In Fed terminology, inflation may be becoming "entrenched".
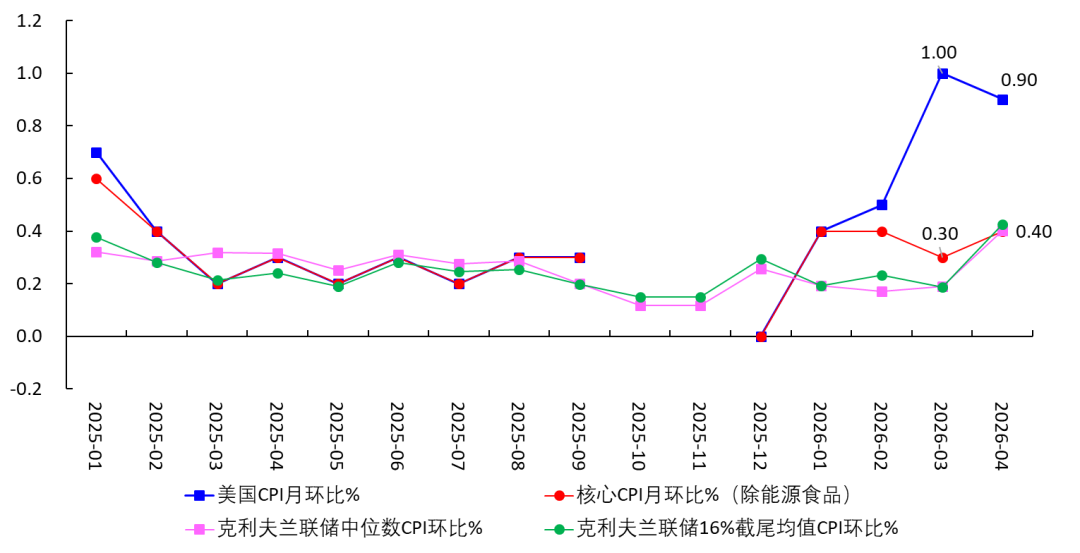
Figure 1 U.S. CPI Month-on-Month Comparison by Category
Source: U.S. Bureau of Labor Statistics; Cleveland Fed official website
March-April Median CPI month-on-month was 0.19% and 0.4%; Trimmed Mean CPI month-on-month was 0.19% and 0.43%. All indicate energy price hikes are being passed to other goods.
Table 1 U.S. CPI Month-on-Month Comparison by Category
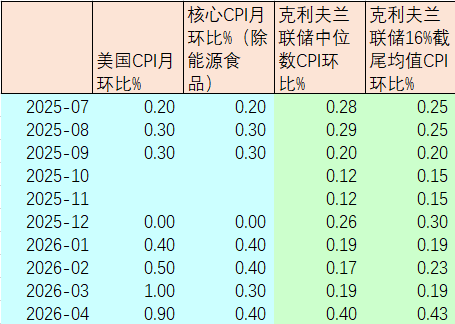
Source: U.S. Bureau of Labor Statistics; Cleveland Fed official website
Figure 2 shows that, influenced by oil prices, CPI year-on-year is far higher than the three core CPI indices. Table 2 shows all three core CPI year-on-year figures are around 2.8%, rising slowly.
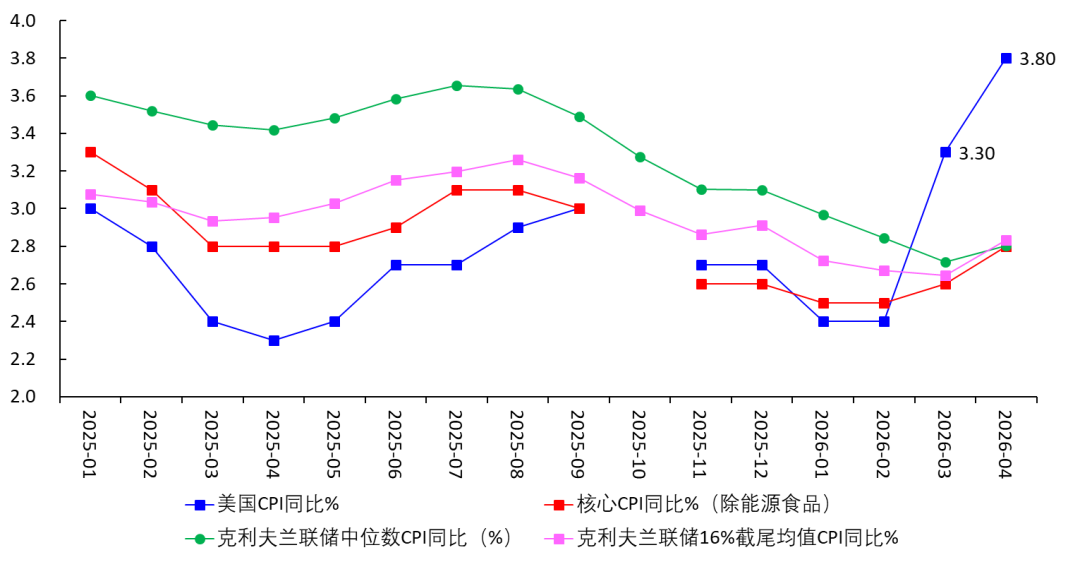
Figure 2 U.S. CPI Year-on-Year Comparison by Category
Source: U.S. Bureau of Labor Statistics; Cleveland Fed official website
Table 2 U.S. CPI Year-on-Year Comparison by Category
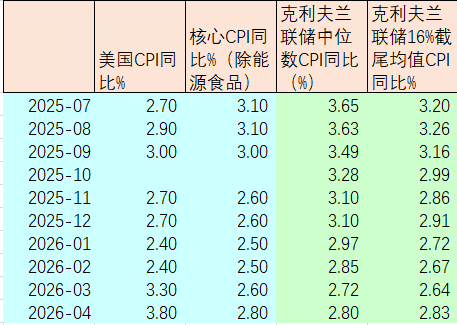
Source: U.S. Bureau of Labor Statistics; Cleveland Fed official website
II. There Is Absolutely No Need to Panic
Currently, the Federal Reserve's interest rate policy decisions reference core PCE (excluding energy and food). Core PCE is published relatively late (end of each month for the previous month). Fed officials usually use CPI to infer PCE.
March core PCE (excluding energy and food) was 3.2%. Based on April CPI performance, I predict April core PCE will edge up to 3.3%-3.4%.
But don’t forget, the day after tomorrow (May 15), Kevin Warsh will take office. He prefers (Dallas Fed’s) Trimmed Mean PCE (see Figure 3).
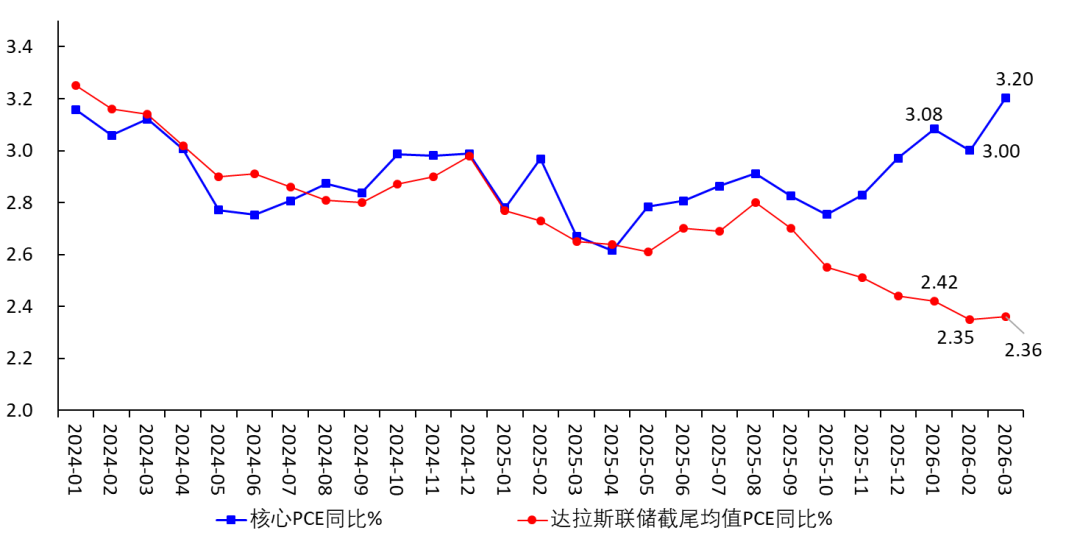
Figure 3 U.S. Core PCE Year-on-Year Comparison
Source: U.S. Bureau of Labor Statistics; Dallas Fed official website
March CPI rose so much (Table 1, Table 2), yet March Trimmed Mean PCE year-on-year only rose 0.01 percentage points (see Figure 3).
Based on April's core CPI month-on-month, I estimate April Trimmed Mean PCE year-on-year will at most rise to 2.45%.
That is to say, Trimmed Mean PCE basically shields the direct impact of energy price hikes; as for the indirect downward transmission, it is currently not that significant.
If Kevin Warsh really implements Trimmed Mean PCE after taking office on May 15, and bases rate policy decisions on Trimmed Mean PCE, then he still has ample grounds to cut rates, just as my analysis shows.
There’s absolutely no need for a rate hike.
There’s absolutely no reason to panic.
Panic over nothing.
Eat if you need to eat, drink if you want to drink, trade if you wish to trade.
Disclaimer: The content of this article solely reflects the author's opinion and does not represent the platform in any capacity. This article is not intended to serve as a reference for making investment decisions.
You may also like
XRP Holders Are About To Get A Huge Shock. Pundit Says No One Sees This Coming
Indian Rupee ticks up as centre hikes import duty on Gold and Silver to 15%
EUR/USD Price Forecast: Consolidates below mid-1.1700s as Iran risks, Fed bets support USD
US Dollar Index remains flat after Trump’s recent Iran threats