
Solana Fails Channel Breakout—$78 Support The Next Destination?

By:Newsbtc
Bitget offers one-stop trading for cryptocurrencies, stocks, and gold. Trade now!
A welcome pack worth 6200 USDT for new users! Sign up now!
An analyst has pointed out how the latest retrace in Solana has come after rejection from the resistance level of a Parallel Channel.
Solana Failed Parallel Channel Resistance Retest
In a new post on X, analyst Ali Martinez has talked about a technical analysis (TA) pattern forming in the daily price chart of Solana. The pattern in question is a “Parallel Channel,” which forms whenever an asset trades between two parallel trendlines.

Like other consolidation patterns in TA, the upper level of the channel acts as a resistance barrier for the price and the lower one can provide support. A break out of either of these levels can signal a continuation of trend in that direction. That is, a surge above the pattern can be a bullish signal, while a fall under it a bearish one.
var rnd = window.rnd || Math.floor(Math.random()*10e6); var pid607465 = window.pid607465 || rnd; var plc607465 = window.plc607465 || 0; var abkw = window.abkw || ''; var absrc = 'https://servedbyadbutler.com/adserve/;ID=172179;size=0x0;setID=607465;type=js;sw='+screen.width+';sh='+screen.height+';spr='+window.devicePixelRatio+';kw='+abkw+';pid='+pid607465+';place='+(plc607465++)+';rnd='+rnd+';click=CLICK_MACRO_PLACEHOLDER'; document.write('
');
if (!window.AdButler){(function(){var s = document.createElement("script"); s.async = true; s.type = "text/javascript";s.src = "https://servedbyadbutler.com/app.js";var n = document.getElementsByTagName("script")[0]; n.parentNode.insertBefore(s, n);}());}
var AdButler = AdButler || {}; AdButler.ads = AdButler.ads || []; var abkw = window.abkw || ""; var plc366606 = window.plc366606 || 0; (function(){ var divs = document.querySelectorAll(".plc366606:not([id])"); var div = divs[divs.length-1]; div.id = "placement_366606_"+plc366606; AdButler.ads.push({handler: function(opt){ AdButler.register(172179, 366606, [728,90], "placement_366606_"+opt.place, opt); }, opt: { place: plc366606++, keywords: abkw, domain: "servedbyadbutler.com", click:"CLICK_MACRO_PLACEHOLDER" }}); })();
Parallel Channels can be of a few different types depending on how the trendlines are oriented with respect to the graph axes, but in the context of the current topic, the variant of interest is the one that has its channel parallel to the time-axis. As the asset trades inside such a pattern, it experiences consolidation in an exactly sideways manner.
Now, here is the chart shared by Martinez that shows the Parallel Channel that the 1-day price of Solana has been stuck inside for the last couple of months:
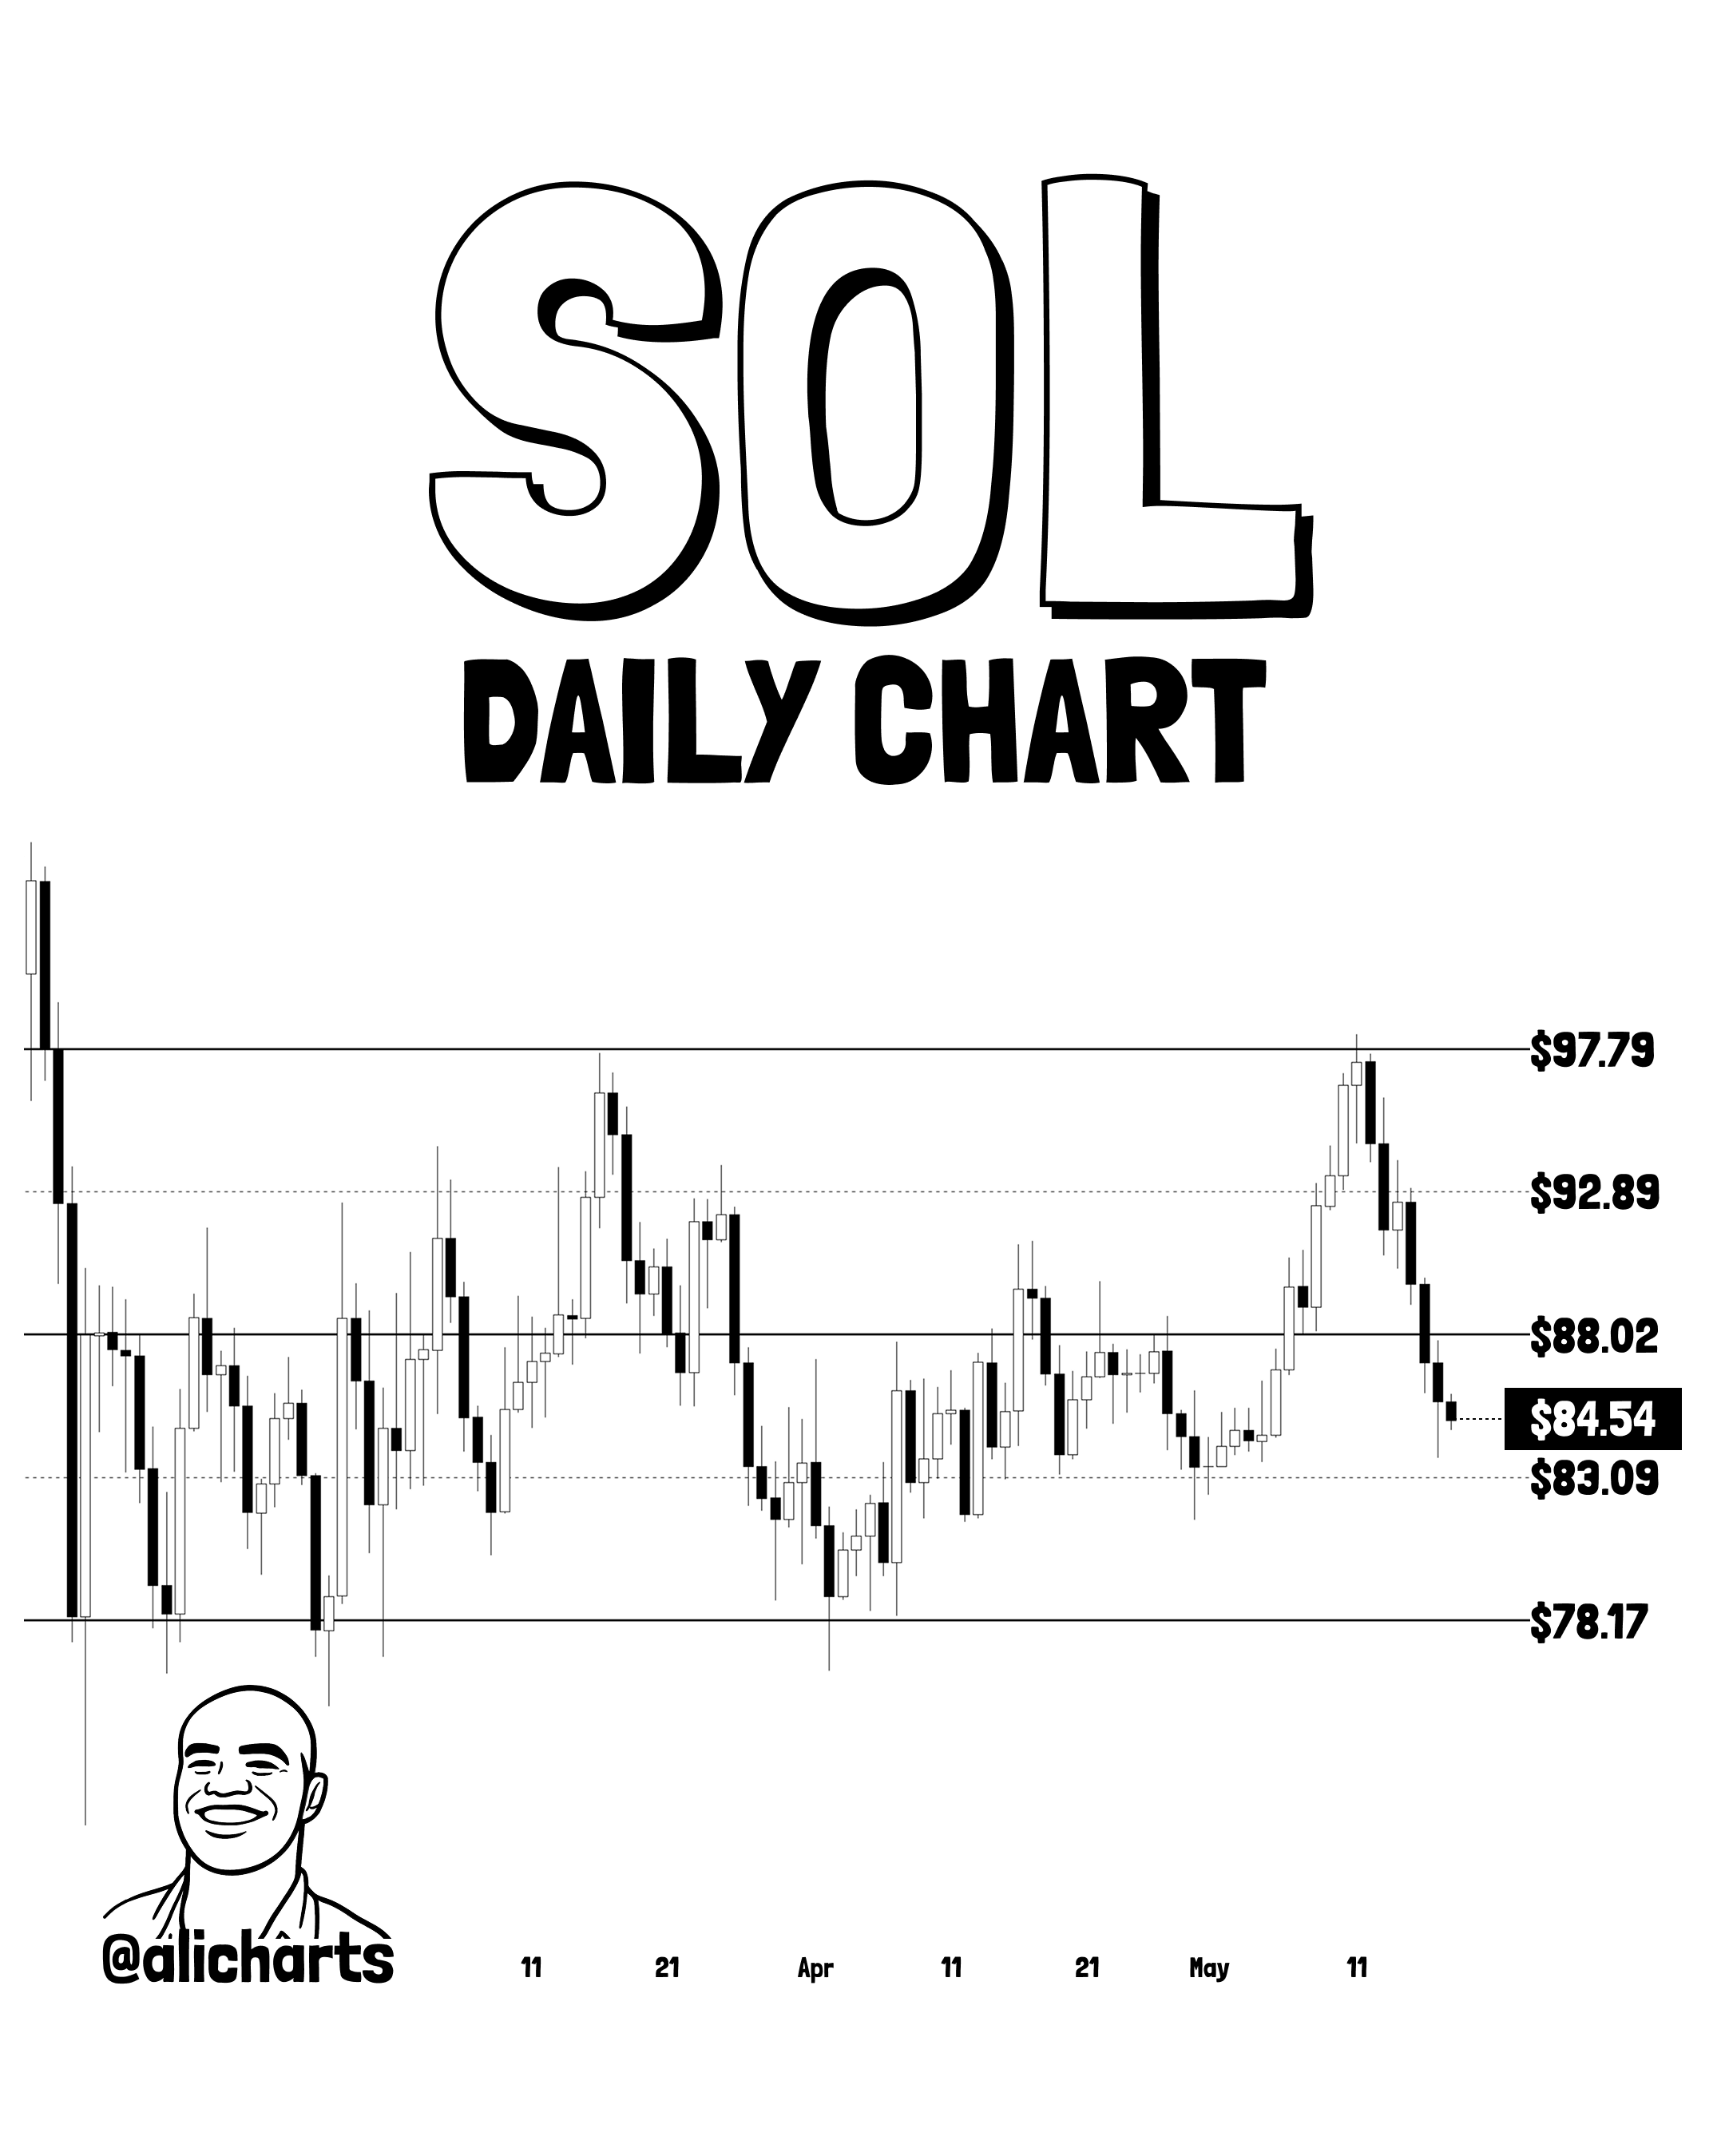 The price of the coin seems to have bounced off the upper level | Source:
@alicharts on X
The price of the coin seems to have bounced off the upper level | Source:
@alicharts on X
As displayed in the above graph, Solana retested the upper level of this Parallel Channel when it rallied toward the $98 mark earlier in the month. The asset couldn’t break past the level’s resistance, however, and its price ended up reversing course.
var rnd = window.rnd || Math.floor(Math.random()*10e6); var pid607472 = window.pid607472 || rnd; var plc607472 = window.plc607472 || 0; var abkw = window.abkw || ''; var absrc = 'https://servedbyadbutler.com/adserve/;ID=172179;size=0x0;setID=607472;type=js;sw='+screen.width+';sh='+screen.height+';spr='+window.devicePixelRatio+';kw='+abkw+';pid='+pid607472+';place='+(plc607472++)+';rnd='+rnd+';click=CLICK_MACRO_PLACEHOLDER'; document.write('
');
if (!window.AdButler){(function(){var s = document.createElement("script"); s.async = true; s.type = "text/javascript";s.src = "https://servedbyadbutler.com/app.js";var n = document.getElementsByTagName("script")[0]; n.parentNode.insertBefore(s, n);}());}
var AdButler = AdButler || {}; AdButler.ads = AdButler.ads || []; var abkw = window.abkw || ""; var plc452518 = window.plc452518 || 0; (function(){ var divs = document.querySelectorAll(".plc452518:not([id])"); var div = divs[divs.length-1]; div.id = "placement_452518_"+plc452518; AdButler.ads.push({handler: function(opt){ AdButler.register(172179, 452518, [728,90], "placement_452518_"+opt.place, opt); }, opt: { place: plc452518++, keywords: abkw, domain: "servedbyadbutler.com", click:"CLICK_MACRO_PLACEHOLDER" }}); })();
Since then, SOL has made its way back into the lower half of the channel. If the current trajectory of the asset continues, it’s possible that the cryptocurrency could end up retesting the lower level situated around $78. It now remains to be seen how Solana will develop in the near future and whether it will have to end up relying on this possible center of support.
As mentioned earlier, there are also other types of Parallel Channels in TA. One such variant is the Descending Channel, which involves trendlines that have a negative slope. Ethereum had earlier been following this kind of pattern on its 4-hour chart, as Martinez highlighted in another X post.
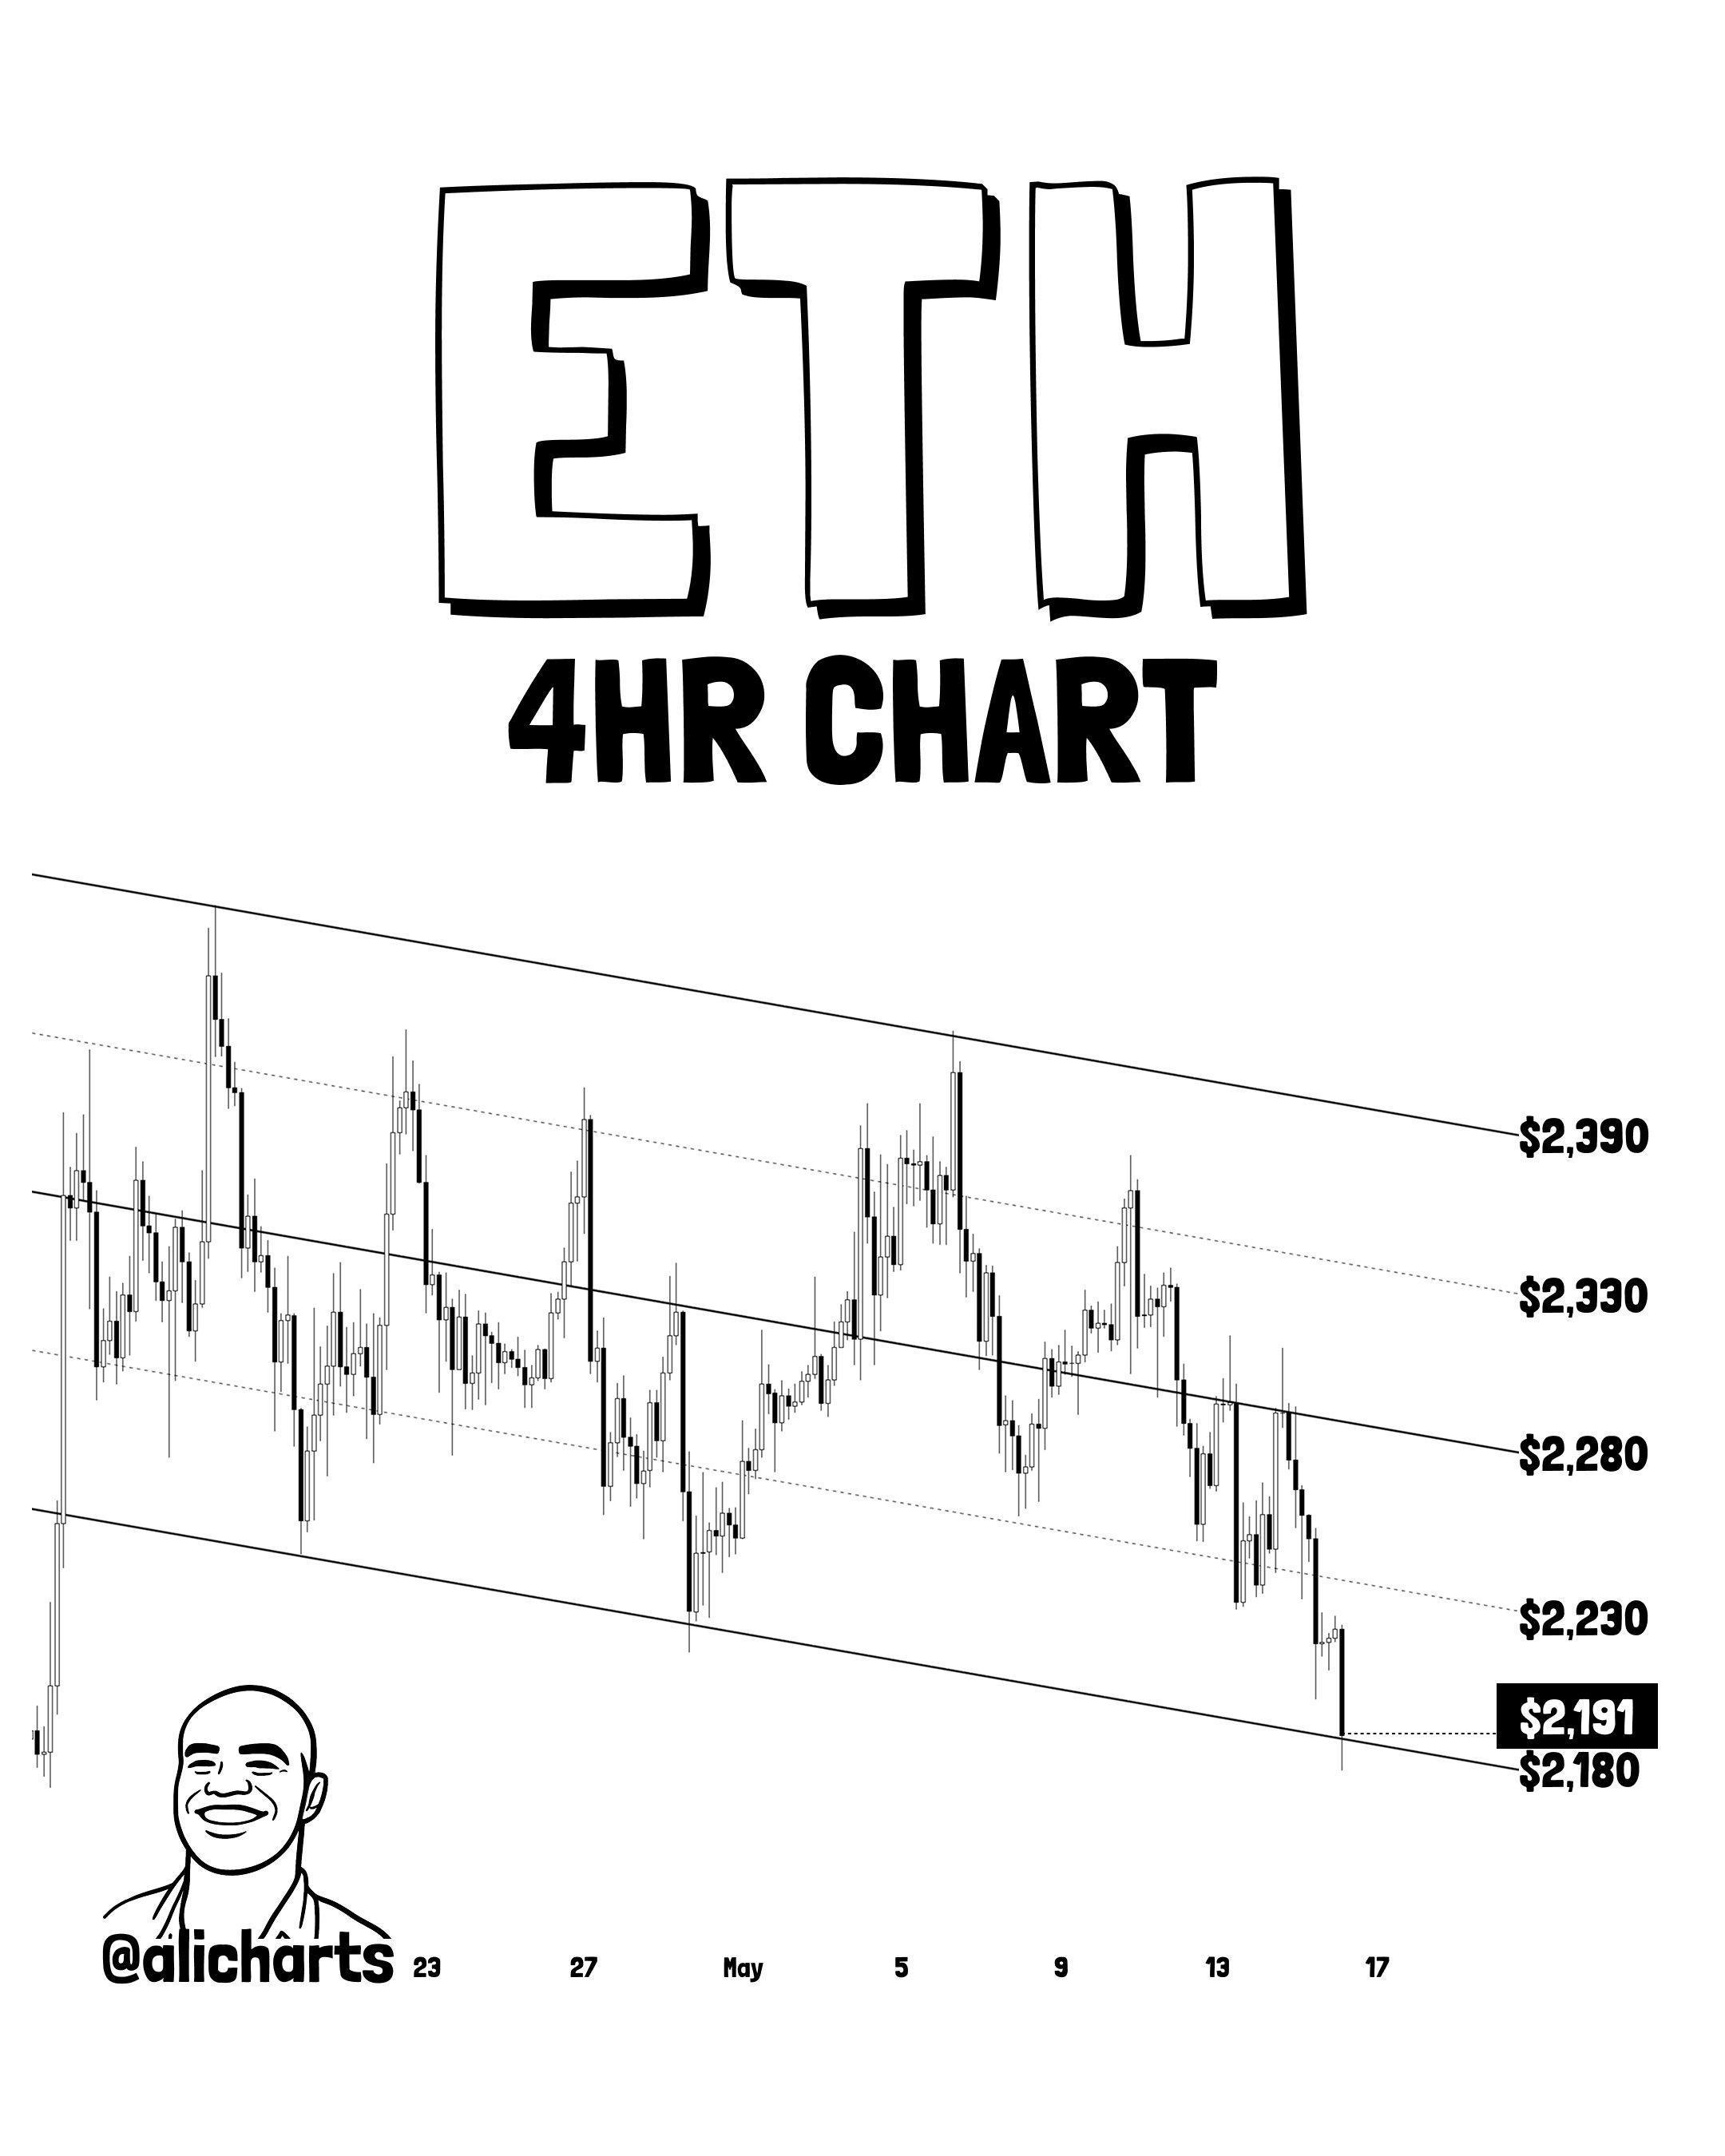 The asset’s trajectory as it stood on Saturday | Source:
@alicharts on X
The asset’s trajectory as it stood on Saturday | Source:
@alicharts on X
From the chart, it’s visible that Ethereum’s 4-hour price was retesting the lower level of the Descending Channel when Martinez shared the pattern. The asset’s drawdown has prolonged since then, and the coin has broken below the support line.
var rnd = window.rnd || Math.floor(Math.random()*10e6); var pid607473 = window.pid607473 || rnd; var plc607473 = window.plc607473 || 0; var abkw = window.abkw || ''; var absrc = 'https://servedbyadbutler.com/adserve/;ID=172179;size=0x0;setID=607473;type=js;sw='+screen.width+';sh='+screen.height+';spr='+window.devicePixelRatio+';kw='+abkw+';pid='+pid607473+';place='+(plc607473++)+';rnd='+rnd+';click=CLICK_MACRO_PLACEHOLDER'; document.write('
');
if (!window.AdButler){(function(){var s = document.createElement("script"); s.async = true; s.type = "text/javascript";s.src = 'https://servedbyadbutler.com/app.js';var n = document.getElementsByTagName("script")[0]; n.parentNode.insertBefore(s, n);}());}
var AdButler = AdButler || {}; AdButler.ads = AdButler.ads || []; var abkw = window.abkw || ''; var plc452519 = window.plc452519 || 0; (function(){ var divs = document.querySelectorAll(".plc452519:not([id])"); var div = divs[divs.length-1]; div.id = "placement_452519_"+plc452519; AdButler.ads.push({handler: function(opt){ AdButler.register(172179, 452519, [728,90], 'placement_452519_'+opt.place, opt); }, opt: { place: plc452519++, keywords: abkw, domain: 'servedbyadbutler.com', click:'CLICK_MACRO_PLACEHOLDER' }}); })();
SOL Price
At the time of writing, Solana is trading around $84, down 13.6% over the past week.
The trend in the price of the coin over the last five days | Source:
SOLUSDT on TradingView
0
0
Disclaimer: The content of this article solely reflects the author's opinion and does not represent the platform in any capacity. This article is not intended to serve as a reference for making investment decisions.
Understand the market, then trade.
Bitget offers one-stop trading for cryptocurrencies, stocks, and gold.
Trade now!
You may also like
XRP RSI Structure: Egrag Crypto Says Remember Who Charted It First
TimesTabloid•2026/05/19 13:03
US Morning News Call | Trump Says 'Good Chance' of Iran Nuclear Deal
moomoo-证劵•2026/05/19 13:01
XRP Alliance debuts as Flare, D'CENT link hardware wallets to XRP yield vaults
The Block•2026/05/19 13:01
Ethereum News: ETH Hard Fork Culture Is Its Ultimate Quantum Security Advantage
Coinspeaker•2026/05/19 13:00
Trending news
MoreCrypto prices
MoreBitcoin
BTC
$76,815.96
-0.89%
Ethereum
ETH
$2,117.09
-1.52%
Tether USDt
USDT
$0.9992
-0.03%
BNB
BNB
$640.62
-0.39%
XRP
XRP
$1.38
-1.56%
USDC
USDC
$0.9998
-0.01%
Solana
SOL
$84.7
-0.91%
TRON
TRX
$0.3555
-0.41%
Dogecoin
DOGE
$0.1041
-1.79%
Hyperliquid
HYPE
$47.87
+4.69%
How to buy BTC
Bitget lists BTC – Buy or sell BTC quickly on Bitget!
Trade now
Become a trader now?A welcome pack worth 6200 USDT for new users!
Sign up now